Marion County, Oregon Nativity & Citizenship Status (2024)
Place of birth and citizenship status analysis for Marion County, Oregon
Marion County, Oregon Nativity & Citizenship Indicators (2024)
Native Born
86.3%
Foreign Born
13.7%
Naturalized
5.1%
US Citizens
91.4%
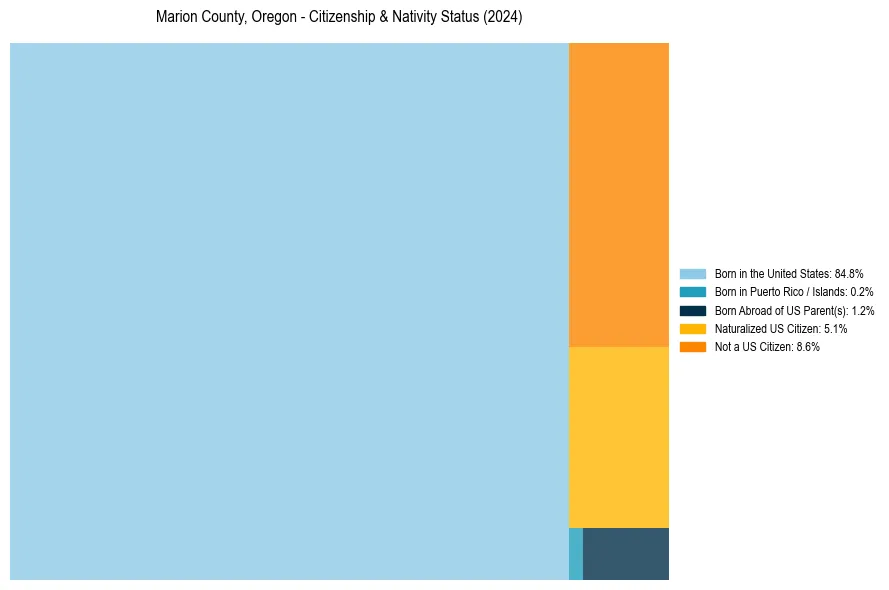
Marion County, Oregon Nativity & Citizenship Distribution
Marion County, Oregon Historical Nativity Trends (2010–2024)
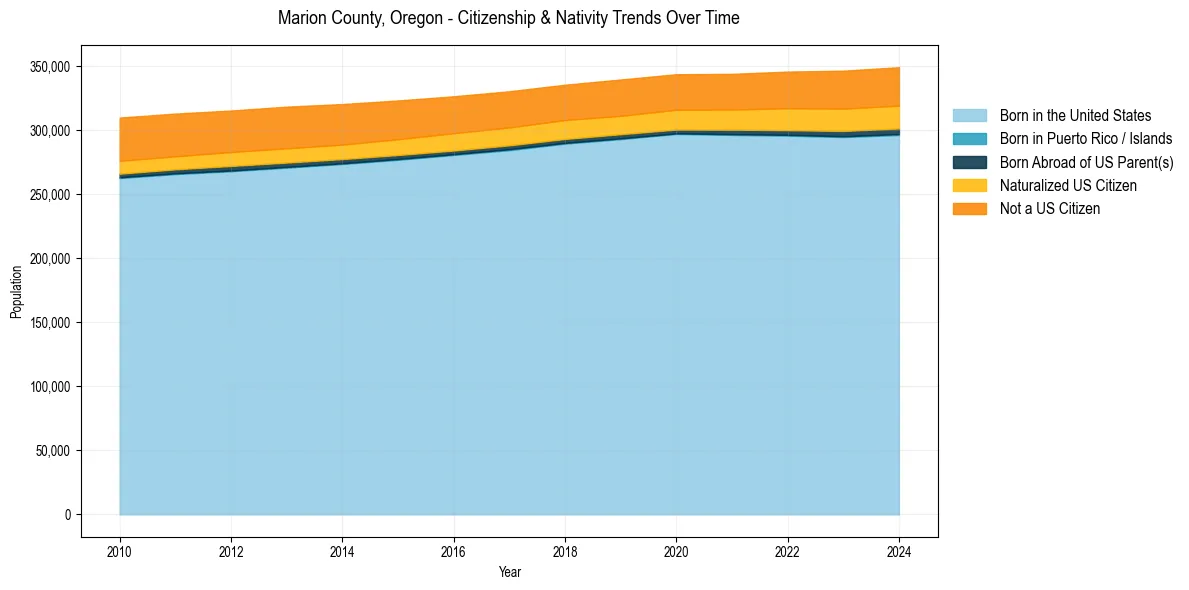
Marion County, Oregon Population & Nativity History
| Year | Total Pop | Foreign Born | Native Born |
|---|---|---|---|
| 2024 | 349,244 | 13.7% | 86.3% |
| 2023 | 346,532 | 13.6% | 86.4% |
| 2022 | 345,815 | 13.2% | 86.8% |
| 2021 | 344,037 | 12.7% | 87.3% |
| 2020 | 343,742 | 12.6% | 87.4% |
| 2019 | 339,641 | 12.6% | 87.4% |
| 2018 | 335,553 | 12.6% | 87.4% |
| 2017 | 330,453 | 12.8% | 87.2% |
| 2016 | 326,527 | 13.0% | 87.0% |
| 2015 | 323,259 | 13.2% | 86.8% |
| 2014 | 320,448 | 13.4% | 86.6% |
| 2013 | 318,441 | 13.7% | 86.3% |
| 2012 | 315,391 | 13.7% | 86.3% |
| 2011 | 313,020 | 13.9% | 86.1% |
| 2010 | 309,894 | 14.1% | 85.9% |
Nativity & Citizenship FAQs for Marion County, Oregon
Approximately 13.7% of residents in Marion County, Oregon were born outside the United States.
The vast majority of residents, roughly 91.4%, are U.S. citizens (including both native-born and naturalized citizens).