Morrow County, Oregon Nativity & Citizenship Status (2024)
Place of birth and citizenship status analysis for Morrow County, Oregon
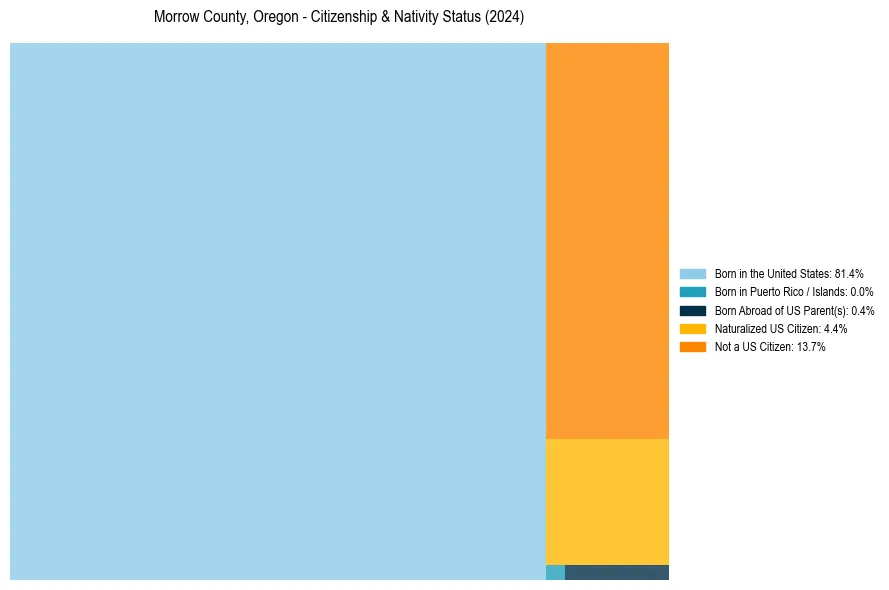
Morrow County, Oregon Nativity & Citizenship Indicators (2024)
Native Born
81.9%
Foreign Born
18.1%
Naturalized
4.4%
US Citizens
86.3%
Morrow County, Oregon Nativity & Citizenship Distribution
Morrow County, Oregon Historical Nativity Trends (2010–2024)
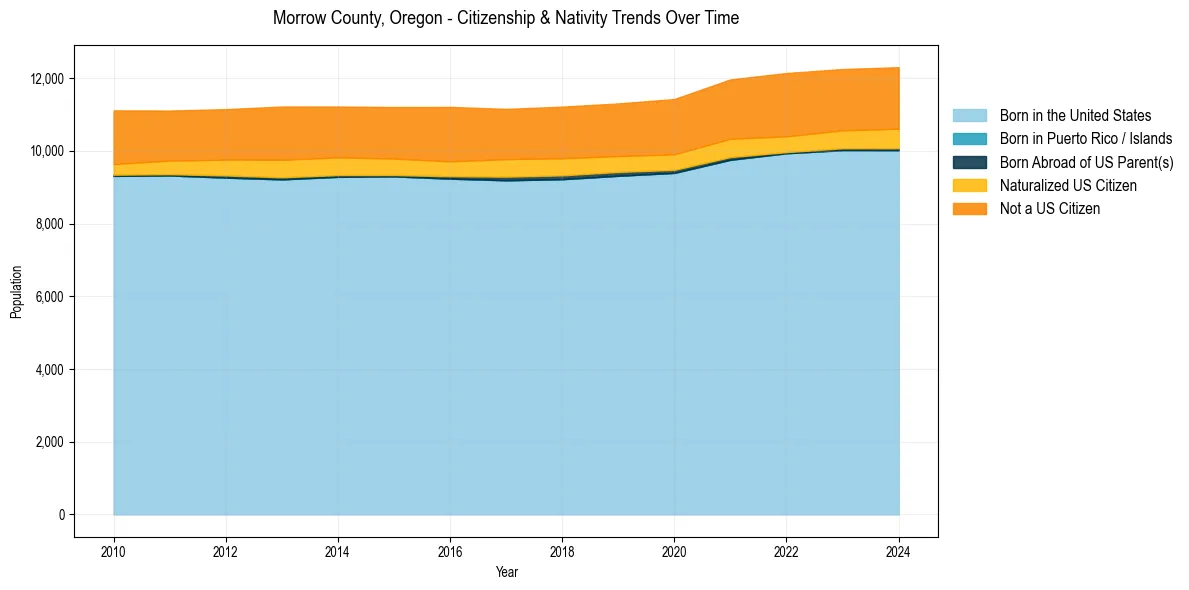
Morrow County, Oregon Population & Nativity History
| Year | Total Pop | Foreign Born | Native Born |
|---|---|---|---|
| 2024 | 12,300 | 18.1% | 81.9% |
| 2023 | 12,249 | 17.8% | 82.2% |
| 2022 | 12,140 | 17.9% | 82.1% |
| 2021 | 11,964 | 17.9% | 82.1% |
| 2020 | 11,425 | 17.1% | 82.9% |
| 2019 | 11,303 | 16.7% | 83.3% |
| 2018 | 11,215 | 16.9% | 83.1% |
| 2017 | 11,153 | 16.7% | 83.3% |
| 2016 | 11,207 | 17.0% | 83.0% |
| 2015 | 11,204 | 16.7% | 83.3% |
| 2014 | 11,217 | 16.8% | 83.2% |
| 2013 | 11,218 | 17.4% | 82.6% |
| 2012 | 11,146 | 16.4% | 83.6% |
| 2011 | 11,107 | 15.8% | 84.2% |
| 2010 | 11,112 | 15.9% | 84.1% |
Nativity & Citizenship FAQs for Morrow County, Oregon
Approximately 18.1% of residents in Morrow County, Oregon were born outside the United States.
The vast majority of residents, roughly 86.3%, are U.S. citizens (including both native-born and naturalized citizens).