Oregon Nativity & Citizenship Status (2024)
Place of birth and citizenship status analysis for Oregon
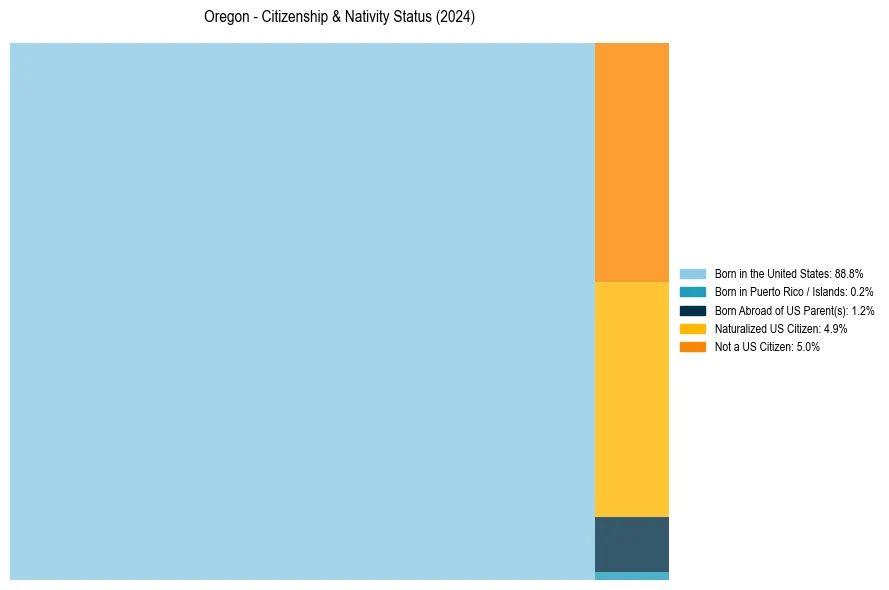
Oregon Nativity & Citizenship Indicators (2024)
Native Born
90.2%
Foreign Born
9.8%
Naturalized
4.9%
US Citizens
95.0%
Oregon Nativity & Citizenship Distribution
Oregon Historical Nativity Trends (2010–2024)
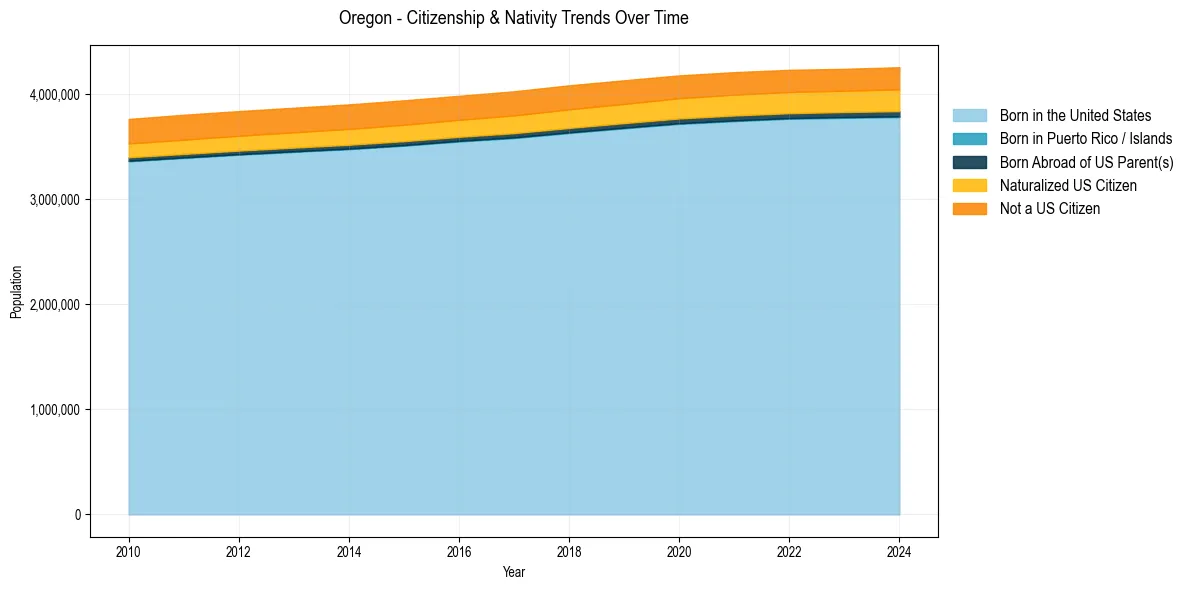
Oregon Population & Nativity History
| Year | Total Pop | Foreign Born | Native Born |
|---|---|---|---|
| 2024 | 4,254,293 | 9.8% | 90.2% |
| 2023 | 4,238,714 | 9.7% | 90.3% |
| 2022 | 4,229,374 | 9.8% | 90.2% |
| 2021 | 4,207,177 | 9.8% | 90.2% |
| 2020 | 4,176,346 | 9.8% | 90.2% |
| 2019 | 4,129,803 | 9.9% | 90.1% |
| 2018 | 4,081,943 | 9.9% | 90.1% |
| 2017 | 4,025,127 | 9.9% | 90.1% |
| 2016 | 3,982,267 | 9.8% | 90.2% |
| 2015 | 3,939,233 | 9.9% | 90.1% |
| 2014 | 3,900,343 | 9.8% | 90.2% |
| 2013 | 3,868,721 | 9.8% | 90.2% |
| 2012 | 3,836,628 | 9.8% | 90.2% |
| 2011 | 3,801,991 | 9.8% | 90.2% |
| 2010 | 3,761,925 | 9.7% | 90.3% |
Nativity & Citizenship FAQs for Oregon
Approximately 9.8% of residents in Oregon were born outside the United States.
The vast majority of residents, roughly 95.0%, are U.S. citizens (including both native-born and naturalized citizens).