Umatilla County, Oregon Nativity & Citizenship Status (2024)
Place of birth and citizenship status analysis for Umatilla County, Oregon
Umatilla County, Oregon Nativity & Citizenship Indicators (2024)
Native Born
89.1%
Foreign Born
10.9%
Naturalized
3.4%
US Citizens
92.5%
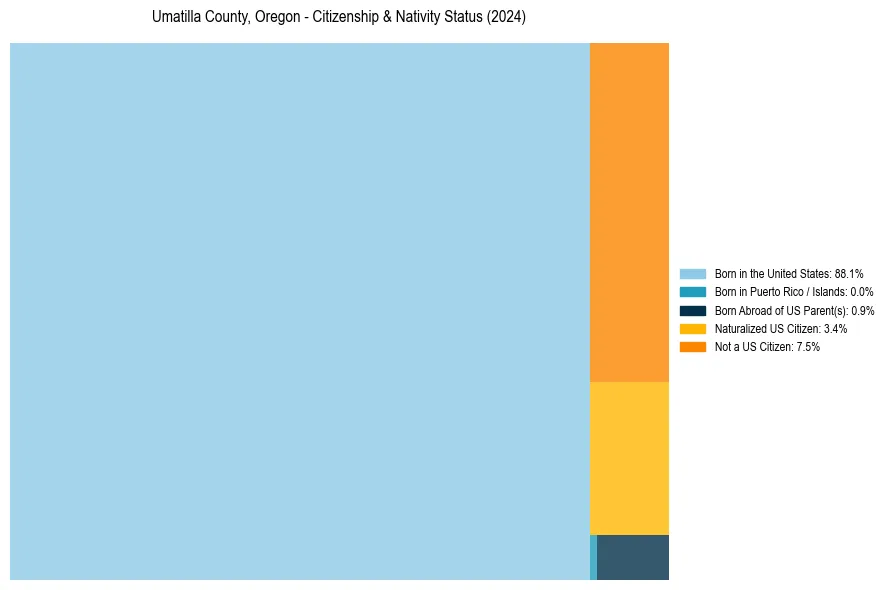
Umatilla County, Oregon Nativity & Citizenship Distribution
Umatilla County, Oregon Historical Nativity Trends (2010–2024)
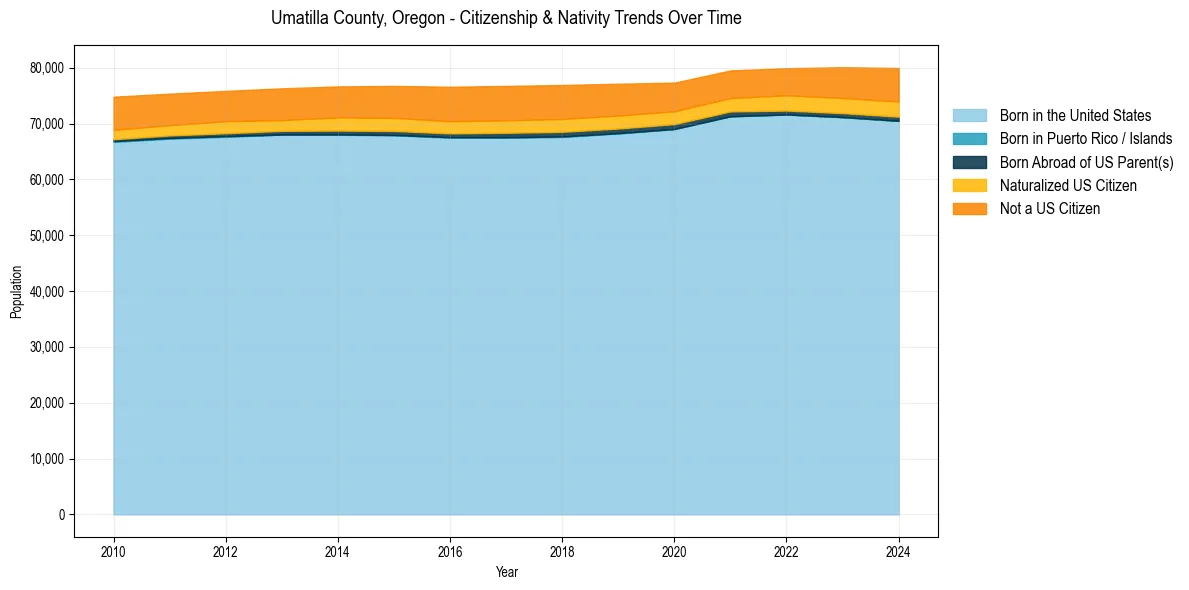
Umatilla County, Oregon Population & Nativity History
| Year | Total Pop | Foreign Born | Native Born |
|---|---|---|---|
| 2024 | 79,940 | 10.9% | 89.1% |
| 2023 | 80,087 | 10.3% | 89.7% |
| 2022 | 79,904 | 9.5% | 90.5% |
| 2021 | 79,509 | 9.2% | 90.8% |
| 2020 | 77,319 | 9.6% | 90.4% |
| 2019 | 77,129 | 10.4% | 89.6% |
| 2018 | 76,898 | 10.9% | 89.1% |
| 2017 | 76,736 | 10.9% | 89.1% |
| 2016 | 76,582 | 10.9% | 89.1% |
| 2015 | 76,738 | 10.5% | 89.5% |
| 2014 | 76,645 | 10.3% | 89.7% |
| 2013 | 76,306 | 10.0% | 90.0% |
| 2012 | 75,846 | 10.0% | 90.0% |
| 2011 | 75,344 | 9.9% | 90.1% |
| 2010 | 74,804 | 10.2% | 89.8% |
Nativity & Citizenship FAQs for Umatilla County, Oregon
Approximately 10.9% of residents in Umatilla County, Oregon were born outside the United States.
The vast majority of residents, roughly 92.5%, are U.S. citizens (including both native-born and naturalized citizens).