Wasco County, Oregon Nativity & Citizenship Status (2024)
Place of birth and citizenship status analysis for Wasco County, Oregon
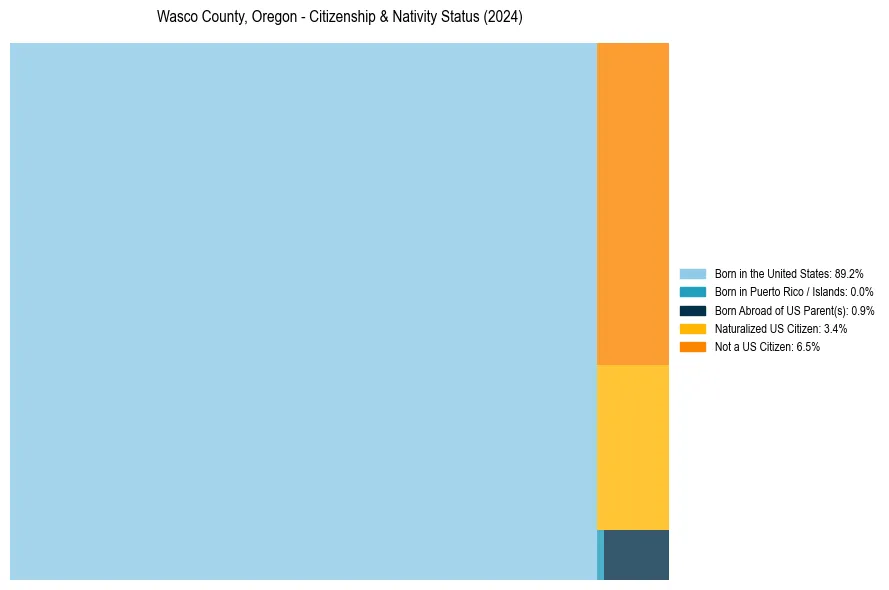
Wasco County, Oregon Nativity & Citizenship Indicators (2024)
Native Born
90.1%
Foreign Born
9.9%
Naturalized
3.4%
US Citizens
93.5%
Wasco County, Oregon Nativity & Citizenship Distribution
Wasco County, Oregon Historical Nativity Trends (2010–2024)
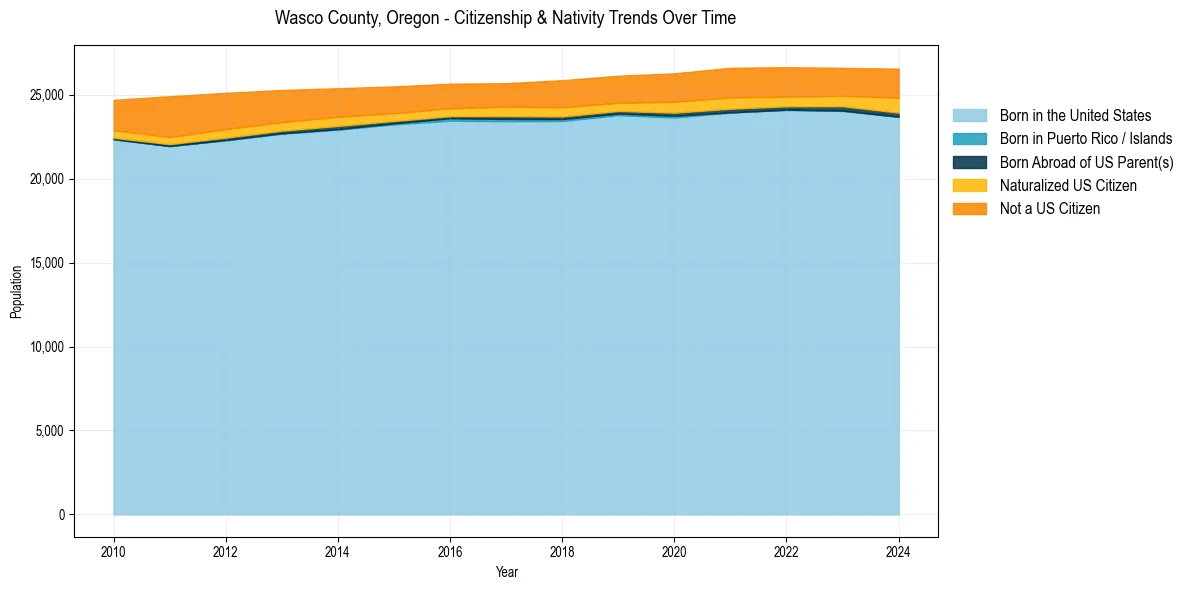
Wasco County, Oregon Population & Nativity History
| Year | Total Pop | Foreign Born | Native Born |
|---|---|---|---|
| 2024 | 26,552 | 9.9% | 90.1% |
| 2023 | 26,603 | 8.6% | 91.4% |
| 2022 | 26,639 | 8.8% | 91.2% |
| 2021 | 26,603 | 9.2% | 90.8% |
| 2020 | 26,274 | 8.9% | 91.1% |
| 2019 | 26,130 | 8.0% | 92.0% |
| 2018 | 25,866 | 8.4% | 91.6% |
| 2017 | 25,687 | 7.6% | 92.4% |
| 2016 | 25,657 | 7.6% | 92.4% |
| 2015 | 25,492 | 8.1% | 91.9% |
| 2014 | 25,387 | 8.9% | 91.1% |
| 2013 | 25,281 | 9.6% | 90.4% |
| 2012 | 25,113 | 10.6% | 89.4% |
| 2011 | 24,910 | 11.5% | 88.5% |
| 2010 | 24,695 | 9.2% | 90.8% |
Nativity & Citizenship FAQs for Wasco County, Oregon
Approximately 9.9% of residents in Wasco County, Oregon were born outside the United States.
The vast majority of residents, roughly 93.5%, are U.S. citizens (including both native-born and naturalized citizens).