Washington County, Oregon Nativity & Citizenship Status (2024)
Place of birth and citizenship status analysis for Washington County, Oregon
Washington County, Oregon Nativity & Citizenship Indicators (2024)
Native Born
81.7%
Foreign Born
18.3%
Naturalized
9.1%
US Citizens
90.8%
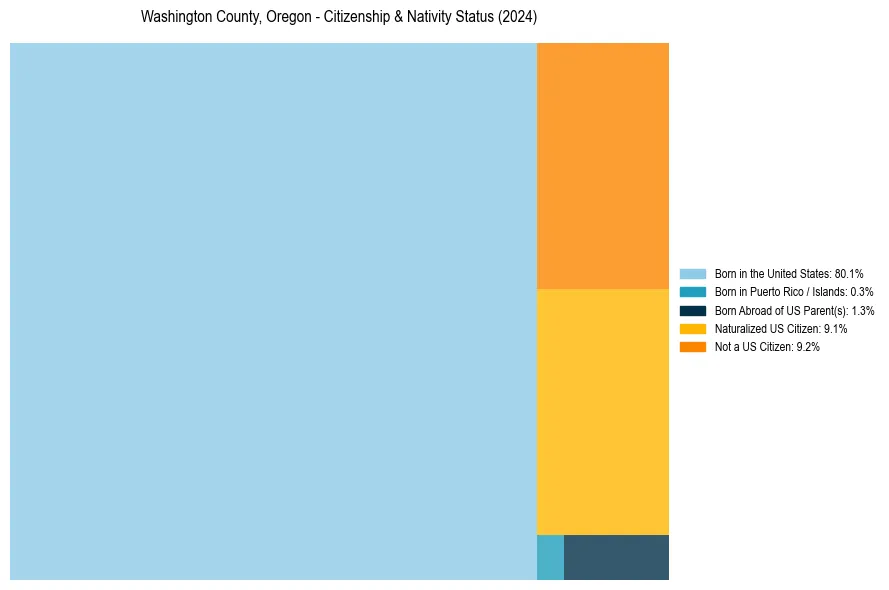
Washington County, Oregon Nativity & Citizenship Distribution
Washington County, Oregon Historical Nativity Trends (2010–2024)
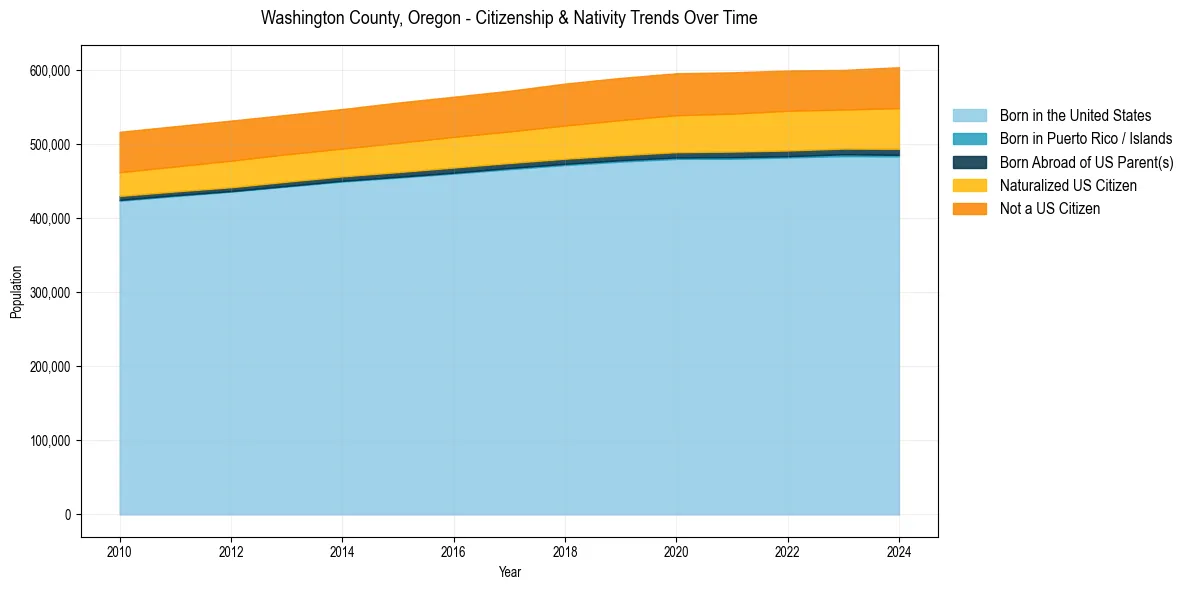
Washington County, Oregon Population & Nativity History
| Year | Total Pop | Foreign Born | Native Born |
|---|---|---|---|
| 2024 | 603,947 | 18.3% | 81.7% |
| 2023 | 600,266 | 17.7% | 82.3% |
| 2022 | 599,541 | 18.0% | 82.0% |
| 2021 | 596,969 | 17.9% | 82.1% |
| 2020 | 595,761 | 17.9% | 82.1% |
| 2019 | 589,481 | 17.7% | 82.3% |
| 2018 | 581,821 | 17.5% | 82.5% |
| 2017 | 572,071 | 17.1% | 82.9% |
| 2016 | 564,088 | 17.0% | 83.0% |
| 2015 | 556,210 | 16.9% | 83.1% |
| 2014 | 547,451 | 16.6% | 83.4% |
| 2013 | 539,608 | 16.7% | 83.3% |
| 2012 | 531,818 | 16.9% | 83.1% |
| 2011 | 524,275 | 16.8% | 83.2% |
| 2010 | 516,665 | 16.8% | 83.2% |
Nativity & Citizenship FAQs for Washington County, Oregon
Approximately 18.3% of residents in Washington County, Oregon were born outside the United States.
The vast majority of residents, roughly 90.8%, are U.S. citizens (including both native-born and naturalized citizens).