Pennsylvania Age & Gender Distribution (2024)
Population distribution by age and gender for Pennsylvania
Pennsylvania Age & Gender Statistics (2024)
Total Population
13,018,639
Median Age
40.9
Male Median
39.8
Female Median
42.2
Pennsylvania Population Growth
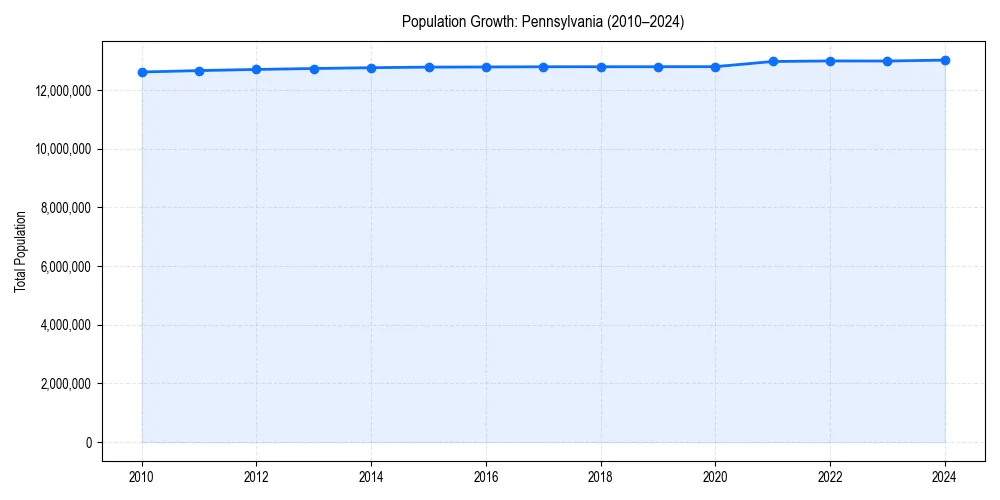
Pennsylvania Demographic Trend
Since 2010, the population of has changed by +3.2%%.
+3.2%% Growth
Pennsylvania Age & Gender Pyramid
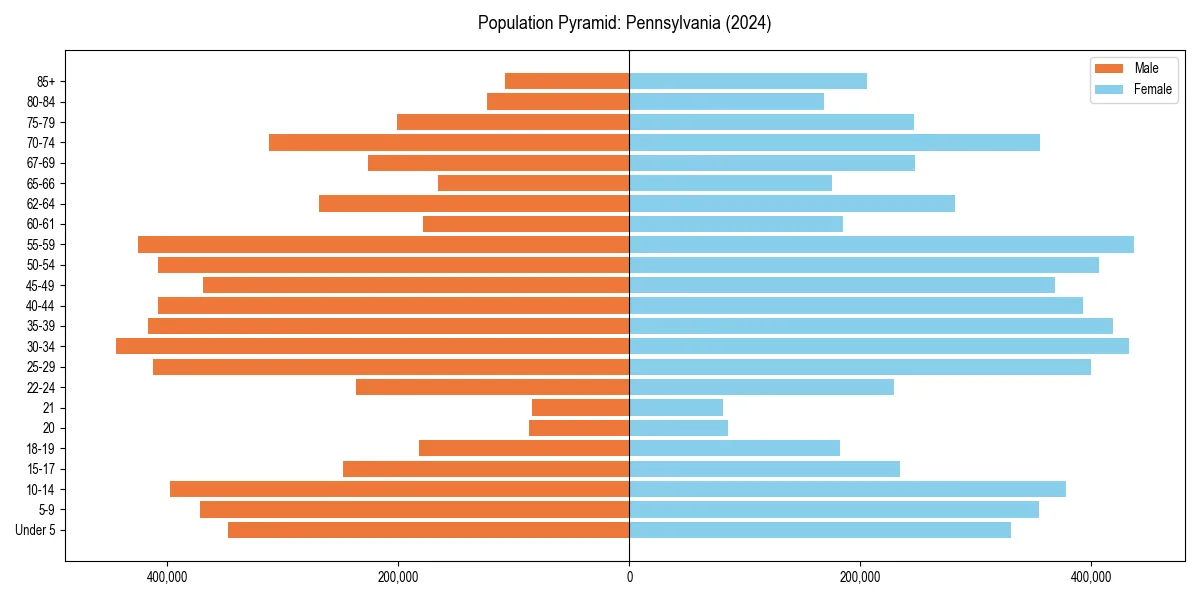
Figure 2: Population distribution by age and gender for 2024.
Pennsylvania Historical Population Data
| Year | Median Age | Population |
|---|---|---|
| 2024 | 40.9 | 13,018,639 |
| 2023 | 40.9 | 12,986,518 |
| 2022 | 40.8 | 12,989,208 |
| 2021 | 40.8 | 12,970,650 |
| 2020 | 40.9 | 12,794,885 |
| 2019 | 40.8 | 12,791,530 |
| 2018 | 40.7 | 12,791,181 |
| 2017 | 40.7 | 12,790,505 |
| 2016 | 40.6 | 12,783,977 |
| 2015 | 40.5 | 12,779,559 |
| 2014 | 40.4 | 12,758,729 |
| 2013 | 40.3 | 12,731,381 |
| 2012 | 40.1 | 12,699,589 |
| 2011 | 39.9 | 12,660,739 |
| 2010 | 39.8 | 12,612,705 |
Pennsylvania Age Group Breakdown (2024)
| Age Cohort | Percentage |
|---|---|
| Under 5 | 5.2% |
| 5–17 | 15.2% |
| 18–24 | 9.0% |
| 25–34 | 13.0% |
| 35–54 | 24.5% |
| 55–64 | 13.6% |
| 65+ | 19.5% |
Dependency Ratios for Pennsylvania
- Total Dependency Ratio:
- 66.4
- Youth Dependency:
- 34.0
- Old-Age Dependency:
- 32.4
The dependency ratio measures dependents (ages 0-17 and 65+) per 100 working-age individuals (ages 18-64).
Age & Gender FAQs for Pennsylvania
The median age in Pennsylvania is 40.9 years.
According to latest Census data, the total population of Pennsylvania is 13,018,639.
In Pennsylvania, seniors (ages 65+) make up 19.5% of the population, while children under 18 represent 15.2%.
Based on historical data since 2010, the population in Pennsylvania has remained stable.