Allegheny County, Pennsylvania Nativity & Citizenship Status (2024)
Place of birth and citizenship status analysis for Allegheny County, Pennsylvania
Allegheny County, Pennsylvania Nativity & Citizenship Indicators (2024)
Native Born
93.4%
Foreign Born
6.6%
Naturalized
3.3%
US Citizens
96.7%
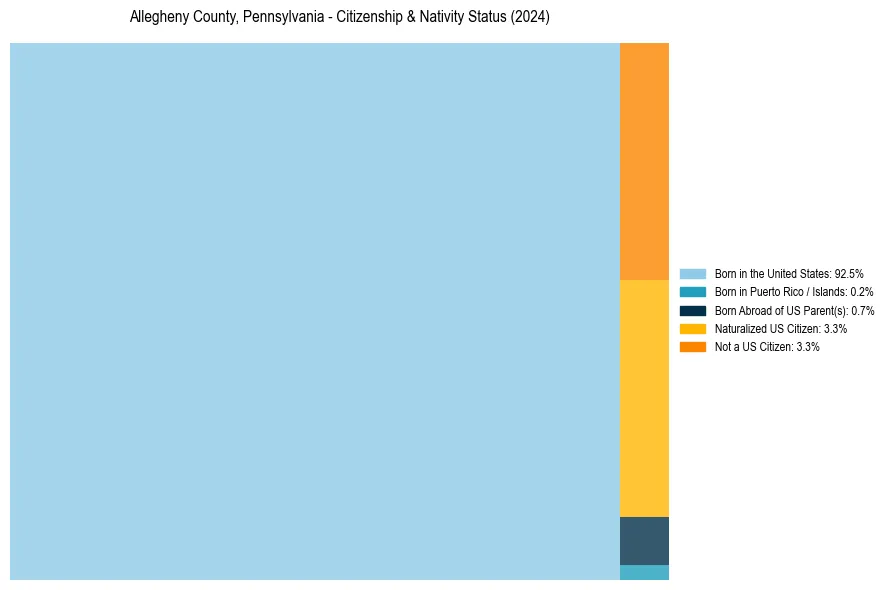
Allegheny County, Pennsylvania Nativity & Citizenship Distribution
Allegheny County, Pennsylvania Historical Nativity Trends (2010–2024)
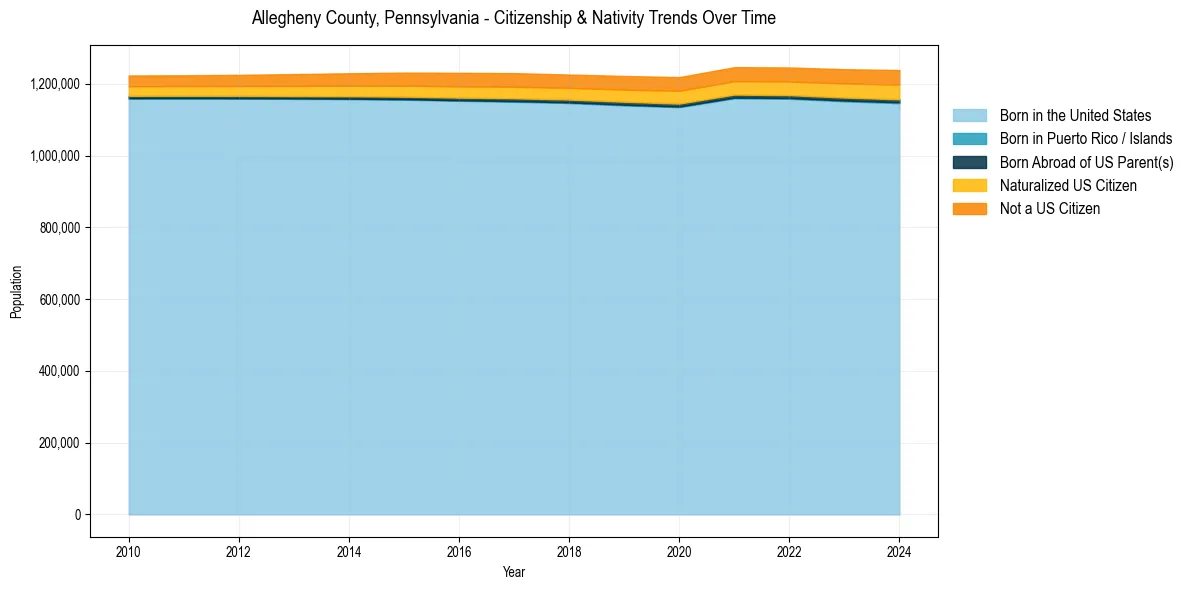
Allegheny County, Pennsylvania Population & Nativity History
| Year | Total Pop | Foreign Born | Native Born |
|---|---|---|---|
| 2024 | 1,238,177 | 6.6% | 93.4% |
| 2023 | 1,240,476 | 6.4% | 93.6% |
| 2022 | 1,245,310 | 6.2% | 93.8% |
| 2021 | 1,246,116 | 6.1% | 93.9% |
| 2020 | 1,218,380 | 6.1% | 93.9% |
| 2019 | 1,221,744 | 5.9% | 94.1% |
| 2018 | 1,225,561 | 5.7% | 94.3% |
| 2017 | 1,229,605 | 5.7% | 94.3% |
| 2016 | 1,230,360 | 5.6% | 94.4% |
| 2015 | 1,231,145 | 5.5% | 94.5% |
| 2014 | 1,229,172 | 5.2% | 94.8% |
| 2013 | 1,226,933 | 5.0% | 95.0% |
| 2012 | 1,224,772 | 4.8% | 95.2% |
| 2011 | 1,223,525 | 4.7% | 95.3% |
| 2010 | 1,223,066 | 4.6% | 95.4% |
Nativity & Citizenship FAQs for Allegheny County, Pennsylvania
Approximately 6.6% of residents in Allegheny County, Pennsylvania were born outside the United States.
The vast majority of residents, roughly 96.7%, are U.S. citizens (including both native-born and naturalized citizens).