Añasco Municipio, Puerto Rico Nativity & Citizenship Status (2024)
Place of birth and citizenship status analysis for Añasco Municipio, Puerto Rico
Añasco Municipio, Puerto Rico Nativity & Citizenship Indicators (2024)
Native Born
99.5%
Foreign Born
0.5%
Naturalized
0.2%
US Citizens
99.8%
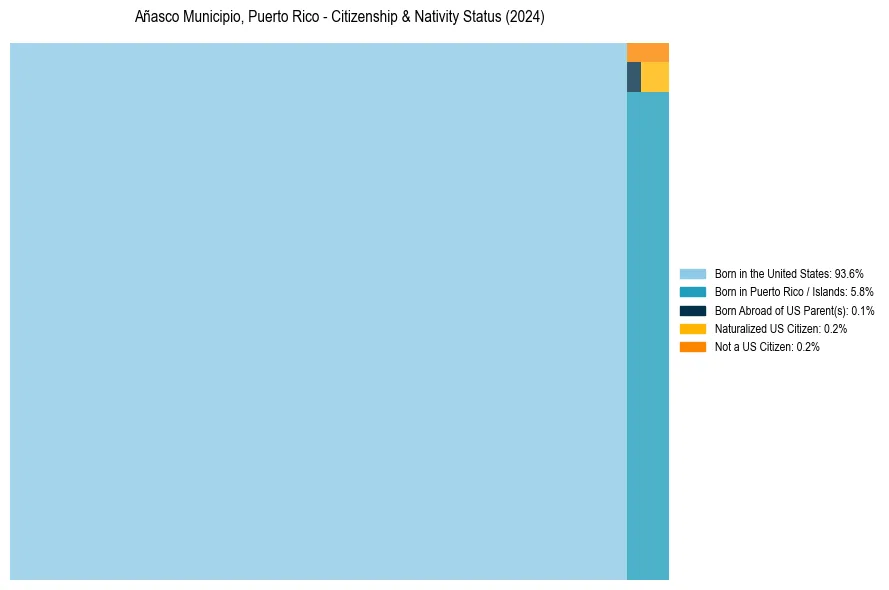
Añasco Municipio, Puerto Rico Nativity & Citizenship Distribution
Añasco Municipio, Puerto Rico Historical Nativity Trends (2010–2024)
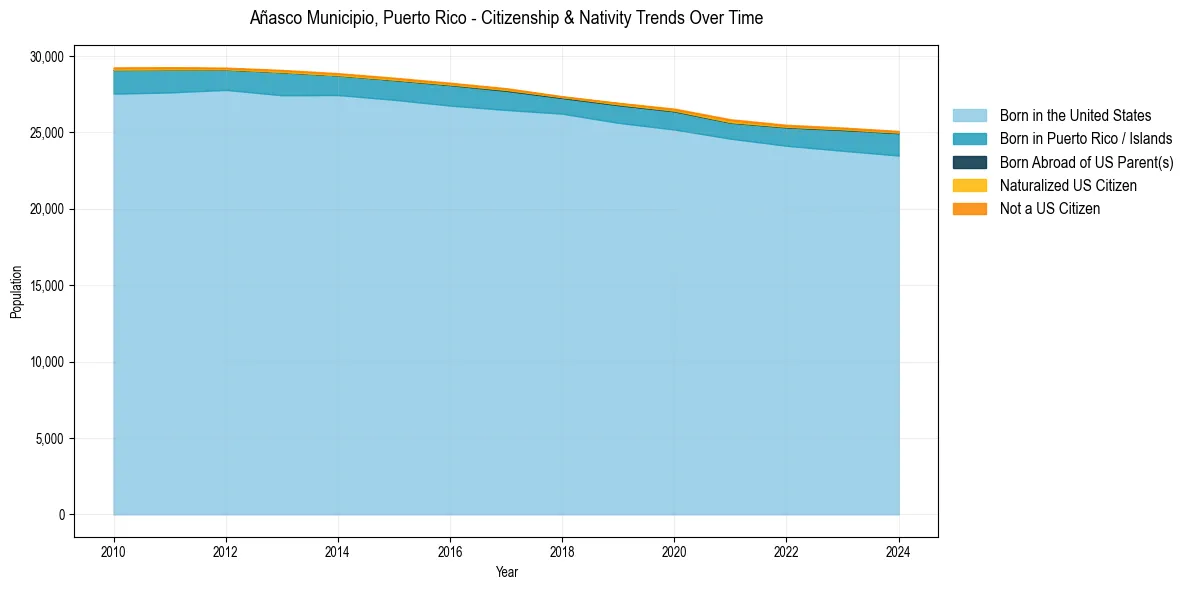
Añasco Municipio, Puerto Rico Population & Nativity History
| Year | Total Pop | Foreign Born | Native Born |
|---|---|---|---|
| 2024 | 25,094 | 0.5% | 99.5% |
| 2023 | 25,316 | 0.5% | 99.5% |
| 2022 | 25,497 | 0.6% | 99.4% |
| 2021 | 25,859 | 0.8% | 99.2% |
| 2020 | 26,555 | 0.5% | 99.5% |
| 2019 | 26,934 | 0.4% | 99.6% |
| 2018 | 27,368 | 0.2% | 99.8% |
| 2017 | 27,892 | 0.4% | 99.6% |
| 2016 | 28,250 | 0.4% | 99.6% |
| 2015 | 28,579 | 0.5% | 99.5% |
| 2014 | 28,874 | 0.5% | 99.5% |
| 2013 | 29,086 | 0.5% | 99.5% |
| 2012 | 29,236 | 0.4% | 99.6% |
| 2011 | 29,266 | 0.5% | 99.5% |
| 2010 | 29,254 | 0.5% | 99.5% |
Nativity & Citizenship FAQs for Añasco Municipio, Puerto Rico
Approximately 0.5% of residents in Añasco Municipio, Puerto Rico were born outside the United States.
The vast majority of residents, roughly 99.8%, are U.S. citizens (including both native-born and naturalized citizens).