Guánica Municipio, Puerto Rico Nativity & Citizenship Status (2024)
Place of birth and citizenship status analysis for Guánica Municipio, Puerto Rico
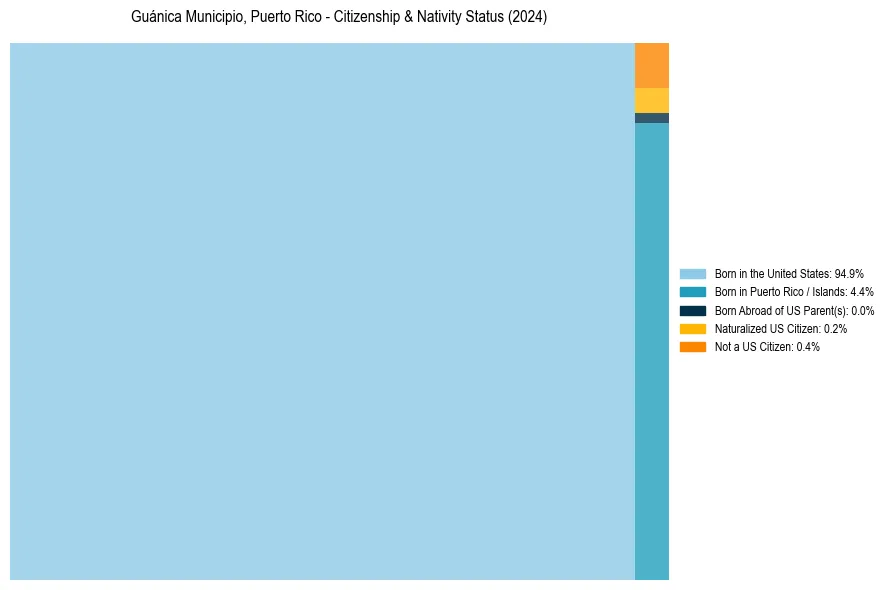
Guánica Municipio, Puerto Rico Nativity & Citizenship Indicators (2024)
Native Born
99.3%
Foreign Born
0.7%
Naturalized
0.2%
US Citizens
99.6%
Guánica Municipio, Puerto Rico Nativity & Citizenship Distribution
Guánica Municipio, Puerto Rico Historical Nativity Trends (2010–2024)
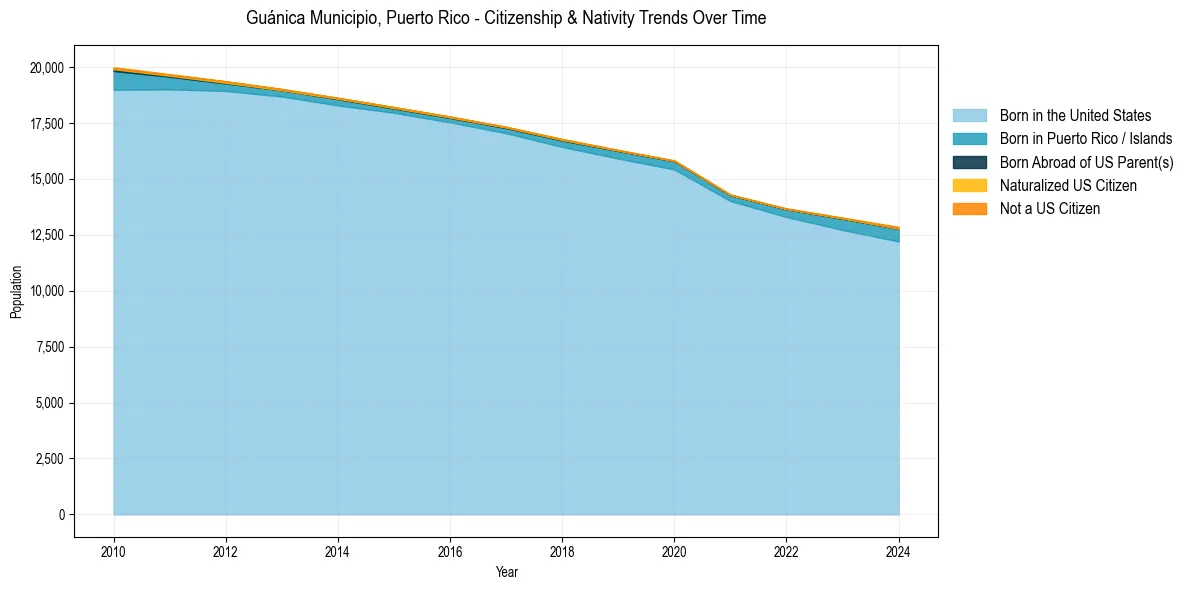
Guánica Municipio, Puerto Rico Population & Nativity History
| Year | Total Pop | Foreign Born | Native Born |
|---|---|---|---|
| 2024 | 12,855 | 0.7% | 99.3% |
| 2023 | 13,266 | 0.3% | 99.7% |
| 2022 | 13,682 | 0.2% | 99.8% |
| 2021 | 14,297 | 0.1% | 99.9% |
| 2020 | 15,825 | 0.2% | 99.8% |
| 2019 | 16,293 | 0.2% | 99.8% |
| 2018 | 16,783 | 0.3% | 99.7% |
| 2017 | 17,327 | 0.2% | 99.8% |
| 2016 | 17,788 | 0.3% | 99.7% |
| 2015 | 18,207 | 0.2% | 99.8% |
| 2014 | 18,627 | 0.3% | 99.7% |
| 2013 | 19,019 | 0.3% | 99.7% |
| 2012 | 19,363 | 0.4% | 99.6% |
| 2011 | 19,680 | 0.4% | 99.6% |
| 2010 | 19,990 | 0.4% | 99.6% |
Nativity & Citizenship FAQs for Guánica Municipio, Puerto Rico
Approximately 0.7% of residents in Guánica Municipio, Puerto Rico were born outside the United States.
The vast majority of residents, roughly 99.6%, are U.S. citizens (including both native-born and naturalized citizens).