Puerto Rico Nativity & Citizenship Status (2024)
Place of birth and citizenship status analysis for Puerto Rico
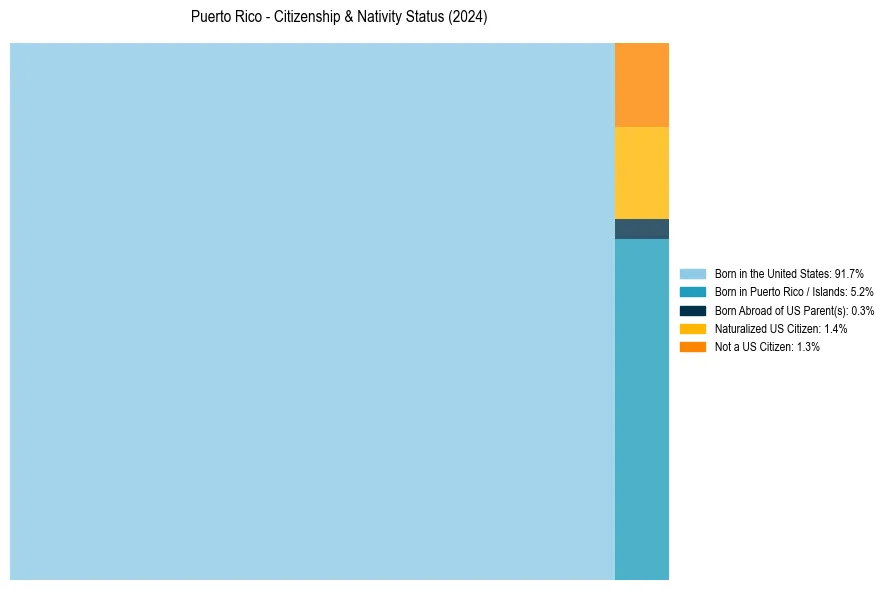
Puerto Rico Nativity & Citizenship Indicators (2024)
Native Born
97.3%
Foreign Born
2.7%
Naturalized
1.4%
US Citizens
98.7%
Puerto Rico Nativity & Citizenship Distribution
Puerto Rico Historical Nativity Trends (2010–2024)
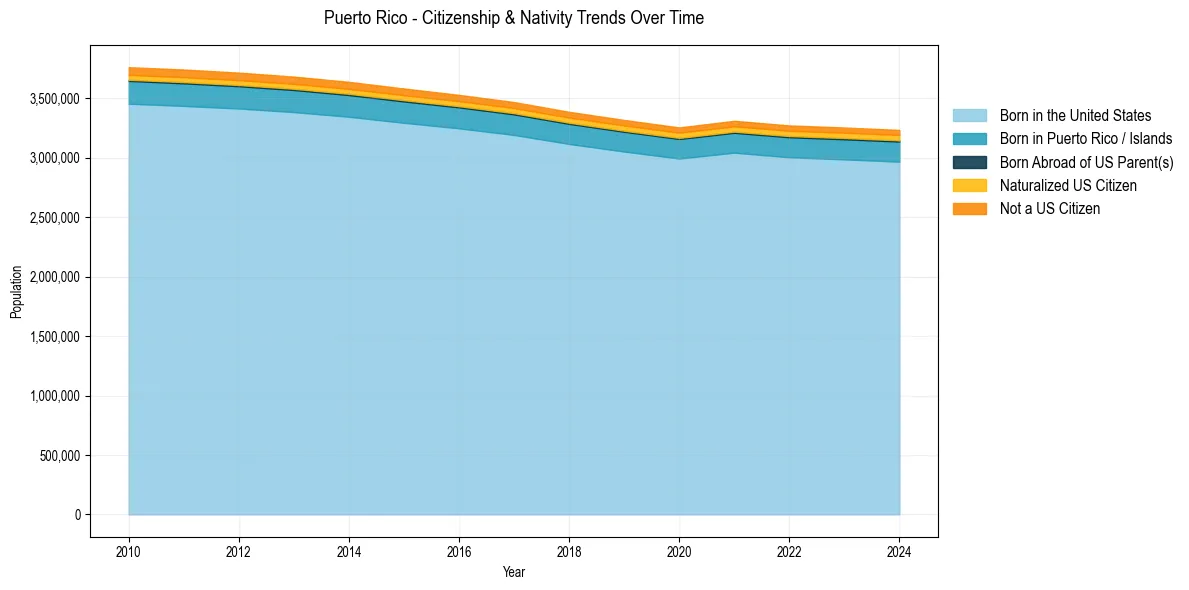
Puerto Rico Population & Nativity History
| Year | Total Pop | Foreign Born | Native Born |
|---|---|---|---|
| 2024 | 3,234,309 | 2.7% | 97.3% |
| 2023 | 3,254,885 | 2.7% | 97.3% |
| 2022 | 3,272,382 | 2.7% | 97.3% |
| 2021 | 3,311,274 | 2.8% | 97.2% |
| 2020 | 3,255,642 | 2.7% | 97.3% |
| 2019 | 3,318,447 | 2.7% | 97.3% |
| 2018 | 3,386,941 | 2.7% | 97.3% |
| 2017 | 3,468,963 | 2.7% | 97.3% |
| 2016 | 3,529,385 | 2.7% | 97.3% |
| 2015 | 3,583,073 | 2.8% | 97.2% |
| 2014 | 3,638,965 | 2.8% | 97.2% |
| 2013 | 3,682,966 | 2.8% | 97.2% |
| 2012 | 3,716,727 | 2.8% | 97.2% |
| 2011 | 3,742,586 | 2.8% | 97.2% |
| 2010 | 3,762,322 | 2.8% | 97.2% |
Nativity & Citizenship FAQs for Puerto Rico
Approximately 2.7% of residents in Puerto Rico were born outside the United States.
The vast majority of residents, roughly 98.7%, are U.S. citizens (including both native-born and naturalized citizens).