Río Grande Municipio, Puerto Rico Nativity & Citizenship Status (2024)
Place of birth and citizenship status analysis for Río Grande Municipio, Puerto Rico
Río Grande Municipio, Puerto Rico Nativity & Citizenship Indicators (2024)
Native Born
98.7%
Foreign Born
1.3%
Naturalized
0.7%
US Citizens
99.4%
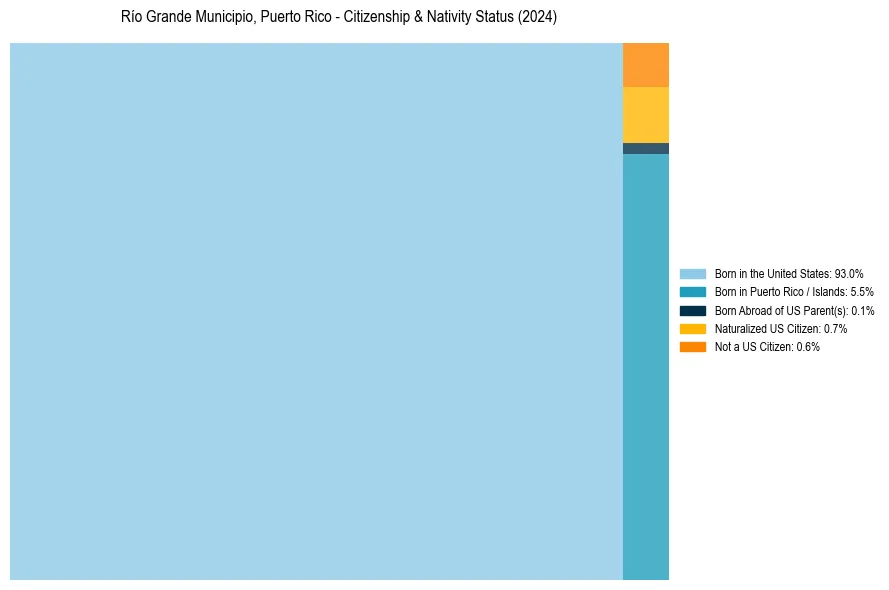
Río Grande Municipio, Puerto Rico Nativity & Citizenship Distribution
Río Grande Municipio, Puerto Rico Historical Nativity Trends (2010–2024)
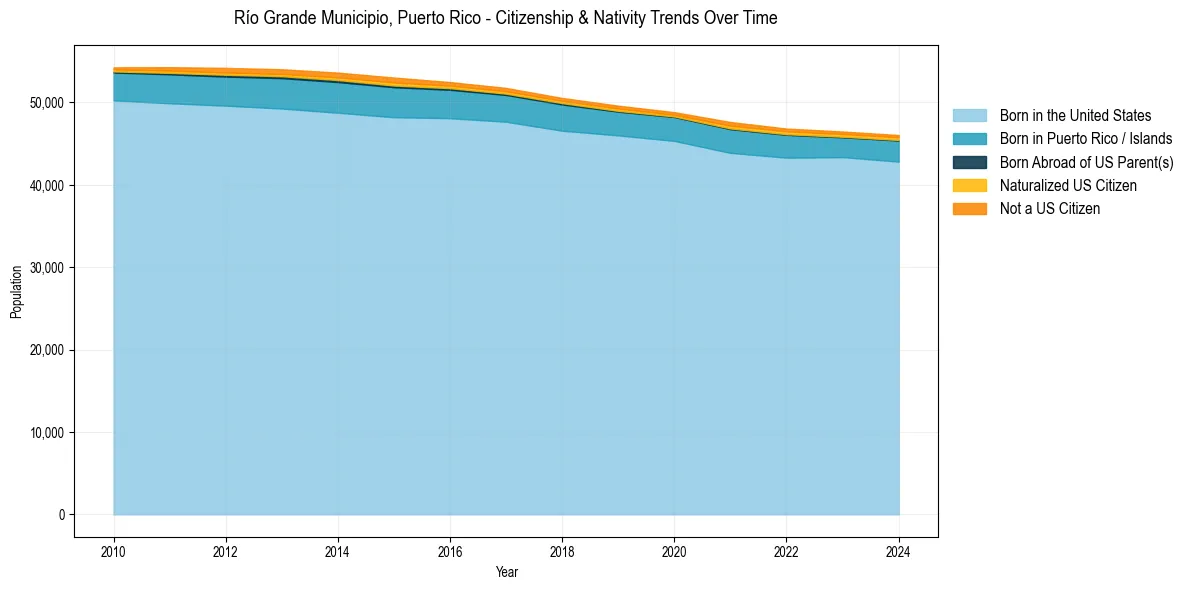
Río Grande Municipio, Puerto Rico Population & Nativity History
| Year | Total Pop | Foreign Born | Native Born |
|---|---|---|---|
| 2024 | 46,051 | 1.3% | 98.7% |
| 2023 | 46,478 | 1.4% | 98.6% |
| 2022 | 46,838 | 1.5% | 98.5% |
| 2021 | 47,630 | 1.6% | 98.4% |
| 2020 | 48,828 | 1.1% | 98.9% |
| 2019 | 49,613 | 1.3% | 98.7% |
| 2018 | 50,550 | 1.2% | 98.8% |
| 2017 | 51,768 | 1.3% | 98.7% |
| 2016 | 52,479 | 1.4% | 98.6% |
| 2015 | 53,029 | 1.8% | 98.2% |
| 2014 | 53,628 | 1.7% | 98.3% |
| 2013 | 54,035 | 1.6% | 98.4% |
| 2012 | 54,203 | 1.5% | 98.5% |
| 2011 | 54,286 | 1.3% | 98.7% |
| 2010 | 54,270 | 0.9% | 99.1% |
Nativity & Citizenship FAQs for Río Grande Municipio, Puerto Rico
Approximately 1.3% of residents in Río Grande Municipio, Puerto Rico were born outside the United States.
The vast majority of residents, roughly 99.4%, are U.S. citizens (including both native-born and naturalized citizens).