San Germán Municipio, Puerto Rico Nativity & Citizenship Status (2024)
Place of birth and citizenship status analysis for San Germán Municipio, Puerto Rico
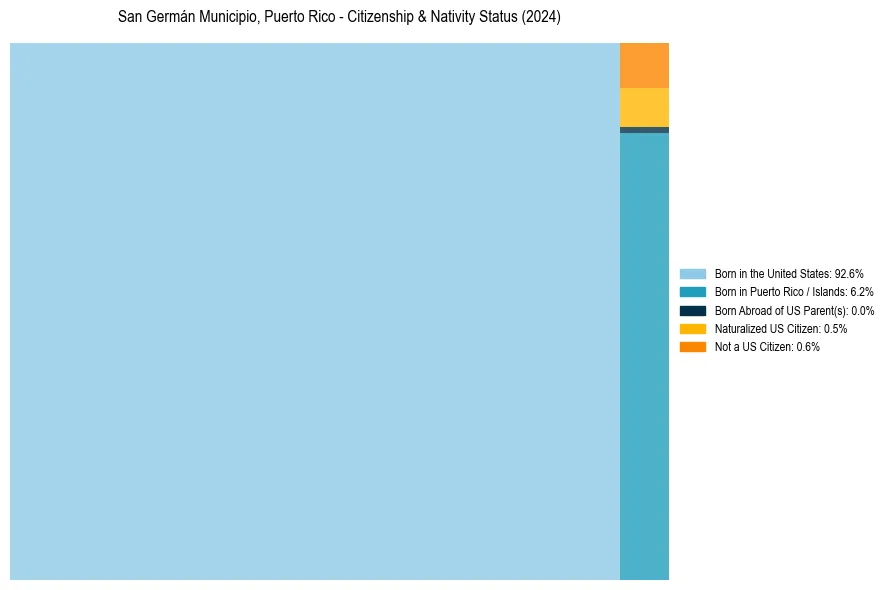
San Germán Municipio, Puerto Rico Nativity & Citizenship Indicators (2024)
Native Born
98.8%
Foreign Born
1.2%
Naturalized
0.5%
US Citizens
99.4%
San Germán Municipio, Puerto Rico Nativity & Citizenship Distribution
San Germán Municipio, Puerto Rico Historical Nativity Trends (2010–2024)
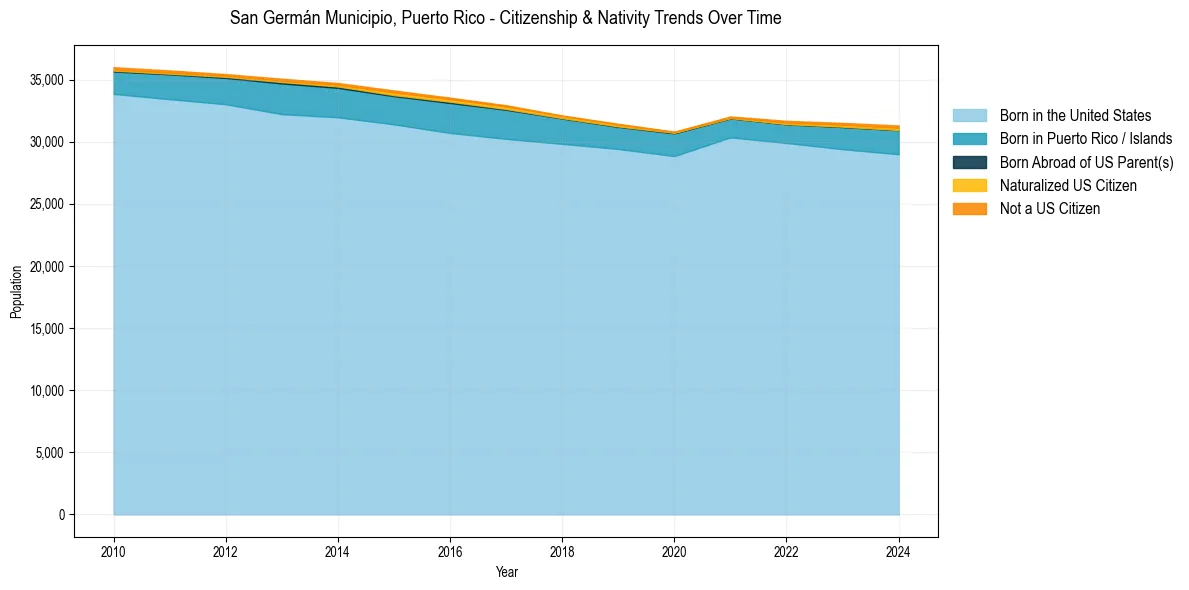
San Germán Municipio, Puerto Rico Population & Nativity History
| Year | Total Pop | Foreign Born | Native Born |
|---|---|---|---|
| 2024 | 31,305 | 1.2% | 98.8% |
| 2023 | 31,514 | 1.0% | 99.0% |
| 2022 | 31,680 | 0.8% | 99.2% |
| 2021 | 32,031 | 0.4% | 99.6% |
| 2020 | 30,811 | 0.3% | 99.7% |
| 2019 | 31,442 | 0.7% | 99.3% |
| 2018 | 32,114 | 0.7% | 99.3% |
| 2017 | 32,937 | 0.9% | 99.1% |
| 2016 | 33,546 | 1.0% | 99.0% |
| 2015 | 34,125 | 1.1% | 98.9% |
| 2014 | 34,725 | 0.8% | 99.2% |
| 2013 | 35,070 | 0.8% | 99.2% |
| 2012 | 35,441 | 0.6% | 99.4% |
| 2011 | 35,736 | 0.7% | 99.3% |
| 2010 | 35,997 | 0.8% | 99.2% |
Nativity & Citizenship FAQs for San Germán Municipio, Puerto Rico
Approximately 1.2% of residents in San Germán Municipio, Puerto Rico were born outside the United States.
The vast majority of residents, roughly 99.4%, are U.S. citizens (including both native-born and naturalized citizens).