United States Race & Ethnicity Demographics (2024)
Racial distribution and diversity statistics for the United States
United States Diversity Indicators (2024)
Total Population
334,922,499
Diversity Score
61.4
Diversity Tier
High
Largest Group
White (Non-Hispanic)
57.4%%
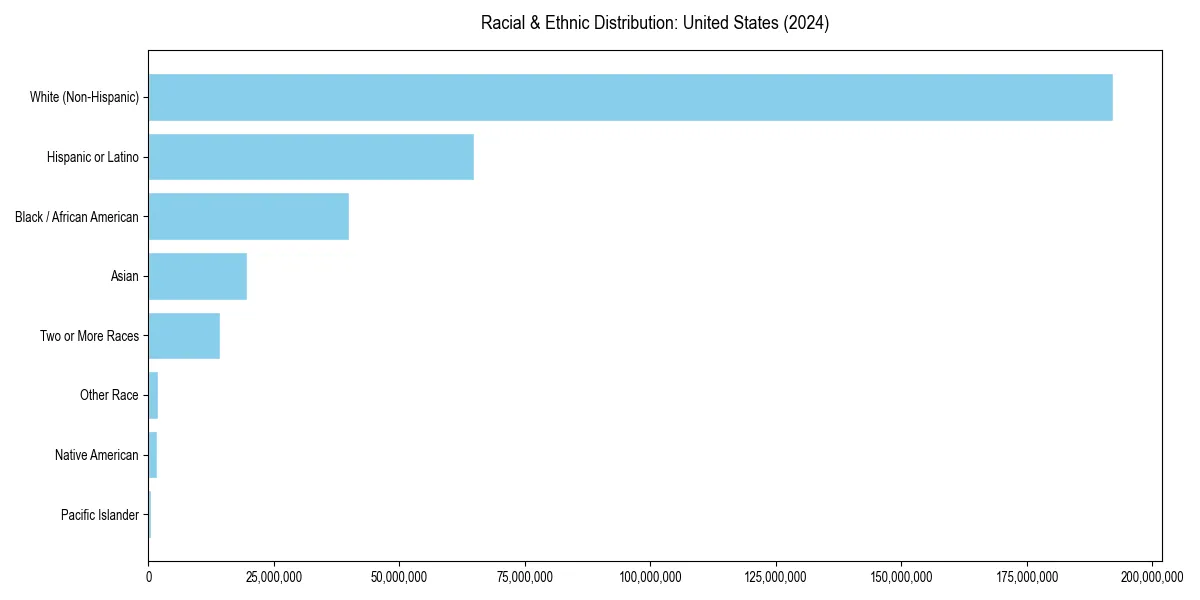
United States Racial & Ethnic Breakdown
United States Historical Diversity Trend (2010–2024)
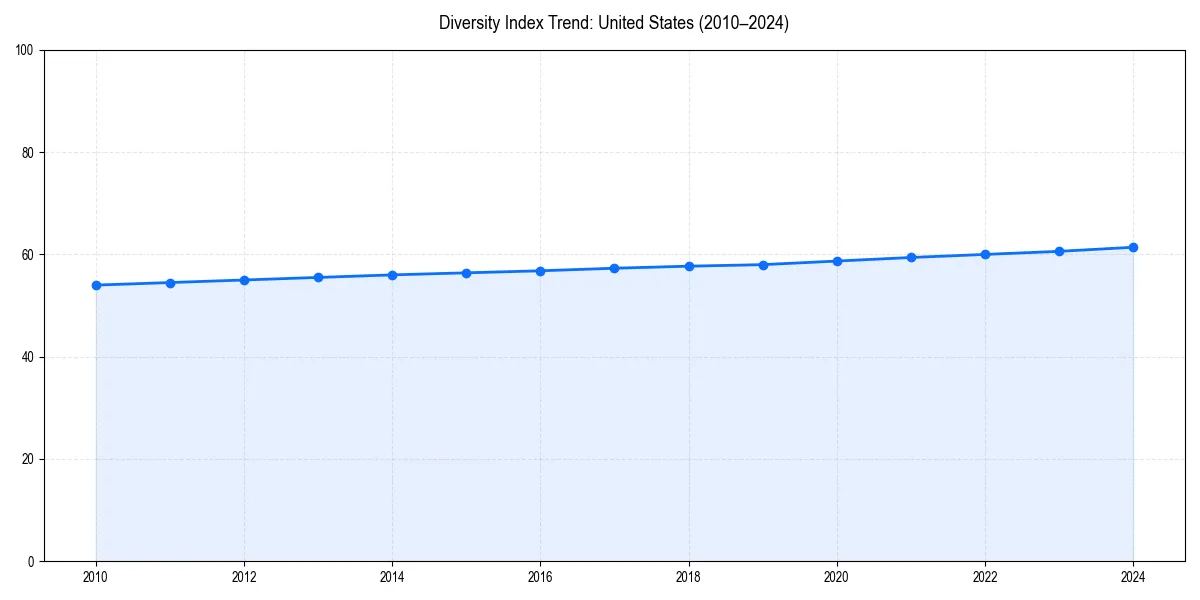
Since 2010, the diversity index of the United States has increased significantly.
United States Population by Race & Ethnicity
| Race / Ethnicity | Population | Percentage |
|---|---|---|
| White (Non-Hispanic) | 192,214,378 | 57.4% |
| Hispanic or Latino | 64,759,370 | 19.3% |
| Black / African American | 39,896,127 | 11.9% |
| Asian | 19,678,814 | 5.9% |
| Two or More Races | 14,240,018 | 4.3% |
| Other Race | 1,868,910 | 0.6% |
| Native American | 1,698,432 | 0.5% |
| Pacific Islander | 566,450 | 0.2% |
Diversity & Demographics FAQs for United States
The largest racial or ethnic group in the United States is White (Non-Hispanic), which makes up 57.4% of the total population.
Since 2010, the diversity index for the United States has increased significantly. The area currently has a diversity score of 61.4/100, which is considered a High level of diversity.