Bedford County, Tennessee Nativity & Citizenship Status (2024)
Place of birth and citizenship status analysis for Bedford County, Tennessee
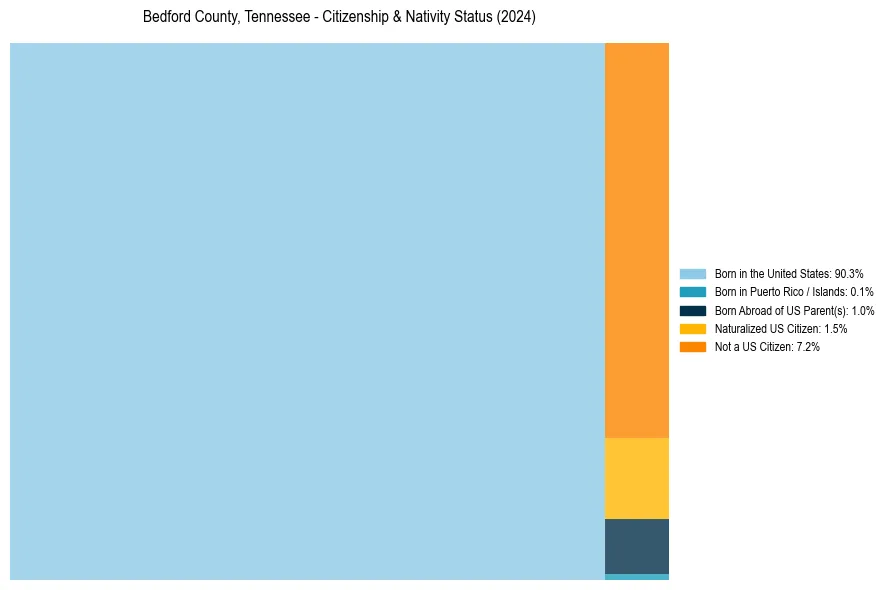
Bedford County, Tennessee Nativity & Citizenship Indicators (2024)
Native Born
91.4%
Foreign Born
8.6%
Naturalized
1.5%
US Citizens
92.8%
Bedford County, Tennessee Nativity & Citizenship Distribution
Bedford County, Tennessee Historical Nativity Trends (2010–2024)
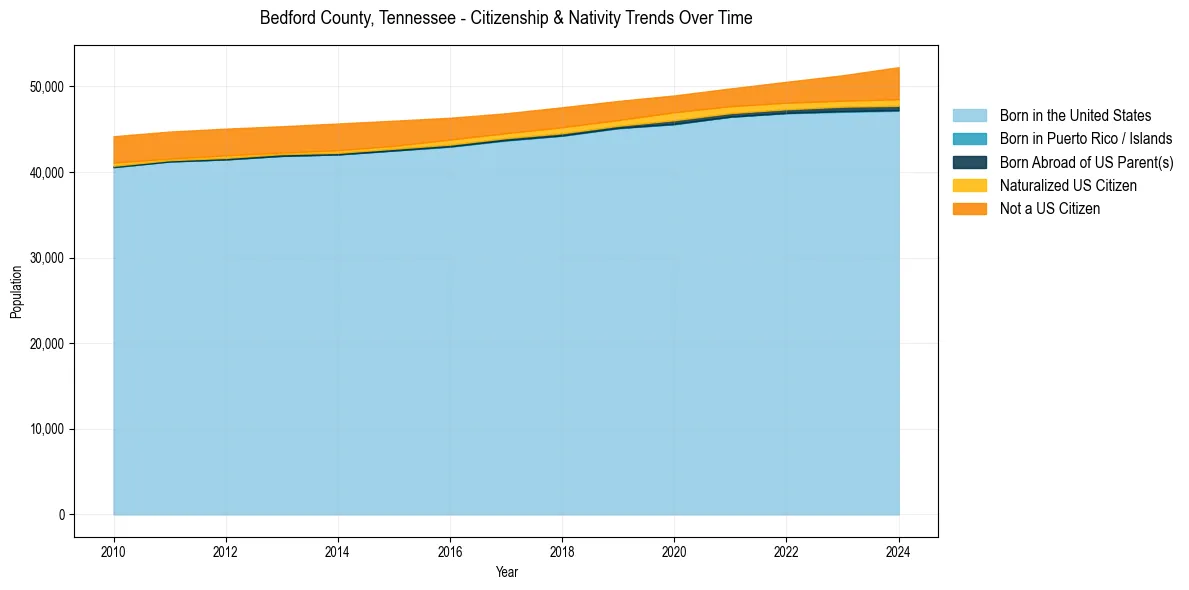
Bedford County, Tennessee Population & Nativity History
| Year | Total Pop | Foreign Born | Native Born |
|---|---|---|---|
| 2024 | 52,237 | 8.6% | 91.4% |
| 2023 | 51,291 | 7.1% | 92.9% |
| 2022 | 50,533 | 6.4% | 93.6% |
| 2021 | 49,754 | 5.8% | 94.2% |
| 2020 | 48,937 | 5.9% | 94.1% |
| 2019 | 48,292 | 6.0% | 94.0% |
| 2018 | 47,558 | 6.4% | 93.6% |
| 2017 | 46,854 | 6.2% | 93.8% |
| 2016 | 46,331 | 6.8% | 93.2% |
| 2015 | 45,986 | 7.1% | 92.9% |
| 2014 | 45,660 | 7.5% | 92.5% |
| 2013 | 45,339 | 7.2% | 92.8% |
| 2012 | 45,060 | 7.6% | 92.4% |
| 2011 | 44,717 | 7.5% | 92.5% |
| 2010 | 44,172 | 7.8% | 92.2% |
Nativity & Citizenship FAQs for Bedford County, Tennessee
Approximately 8.6% of residents in Bedford County, Tennessee were born outside the United States.
The vast majority of residents, roughly 92.8%, are U.S. citizens (including both native-born and naturalized citizens).