Bledsoe County, Tennessee Nativity & Citizenship Status (2024)
Place of birth and citizenship status analysis for Bledsoe County, Tennessee
Bledsoe County, Tennessee Nativity & Citizenship Indicators (2024)
Native Born
97.8%
Foreign Born
2.2%
Naturalized
1.1%
US Citizens
98.9%
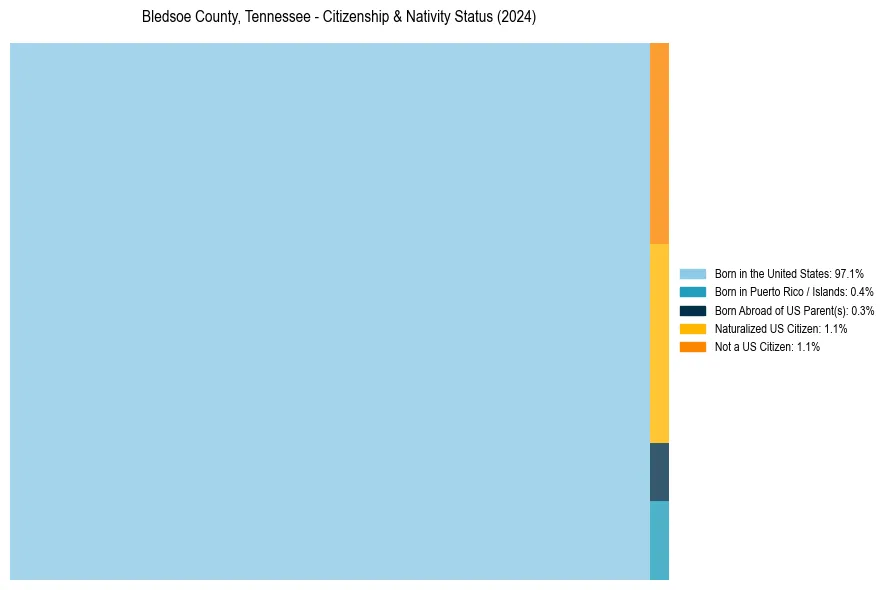
Bledsoe County, Tennessee Nativity & Citizenship Distribution
Bledsoe County, Tennessee Historical Nativity Trends (2010–2024)
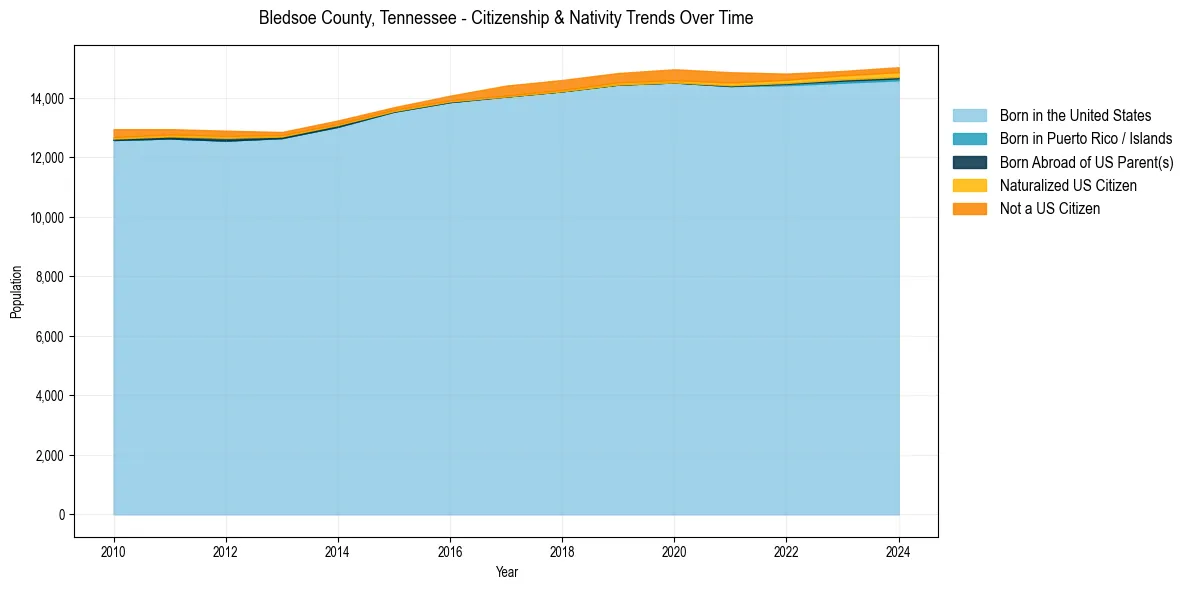
Bledsoe County, Tennessee Population & Nativity History
| Year | Total Pop | Foreign Born | Native Born |
|---|---|---|---|
| 2024 | 15,032 | 2.2% | 97.8% |
| 2023 | 14,905 | 1.9% | 98.1% |
| 2022 | 14,816 | 2.1% | 97.9% |
| 2021 | 14,863 | 2.9% | 97.1% |
| 2020 | 14,961 | 3.0% | 97.0% |
| 2019 | 14,836 | 2.6% | 97.4% |
| 2018 | 14,602 | 2.6% | 97.4% |
| 2017 | 14,413 | 2.5% | 97.5% |
| 2016 | 14,073 | 1.4% | 98.6% |
| 2015 | 13,686 | 1.0% | 99.0% |
| 2014 | 13,240 | 1.2% | 98.8% |
| 2013 | 12,853 | 1.2% | 98.8% |
| 2012 | 12,898 | 1.9% | 98.1% |
| 2011 | 12,949 | 1.9% | 98.1% |
| 2010 | 12,946 | 2.4% | 97.6% |
Nativity & Citizenship FAQs for Bledsoe County, Tennessee
Approximately 2.2% of residents in Bledsoe County, Tennessee were born outside the United States.
The vast majority of residents, roughly 98.9%, are U.S. citizens (including both native-born and naturalized citizens).