Blount County, Tennessee Nativity & Citizenship Status (2024)
Place of birth and citizenship status analysis for Blount County, Tennessee
Blount County, Tennessee Nativity & Citizenship Indicators (2024)
Native Born
96.8%
Foreign Born
3.2%
Naturalized
1.5%
US Citizens
98.4%
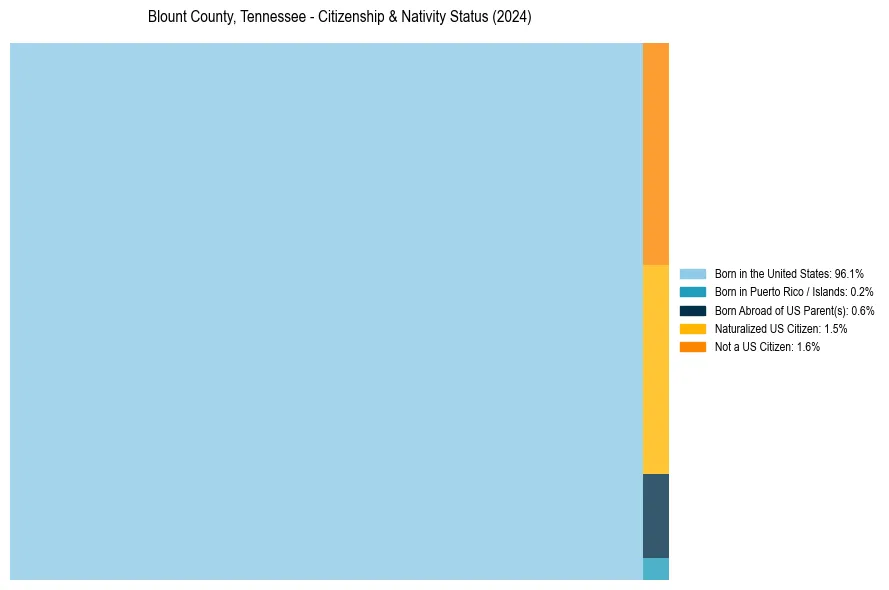
Blount County, Tennessee Nativity & Citizenship Distribution
Blount County, Tennessee Historical Nativity Trends (2010–2024)
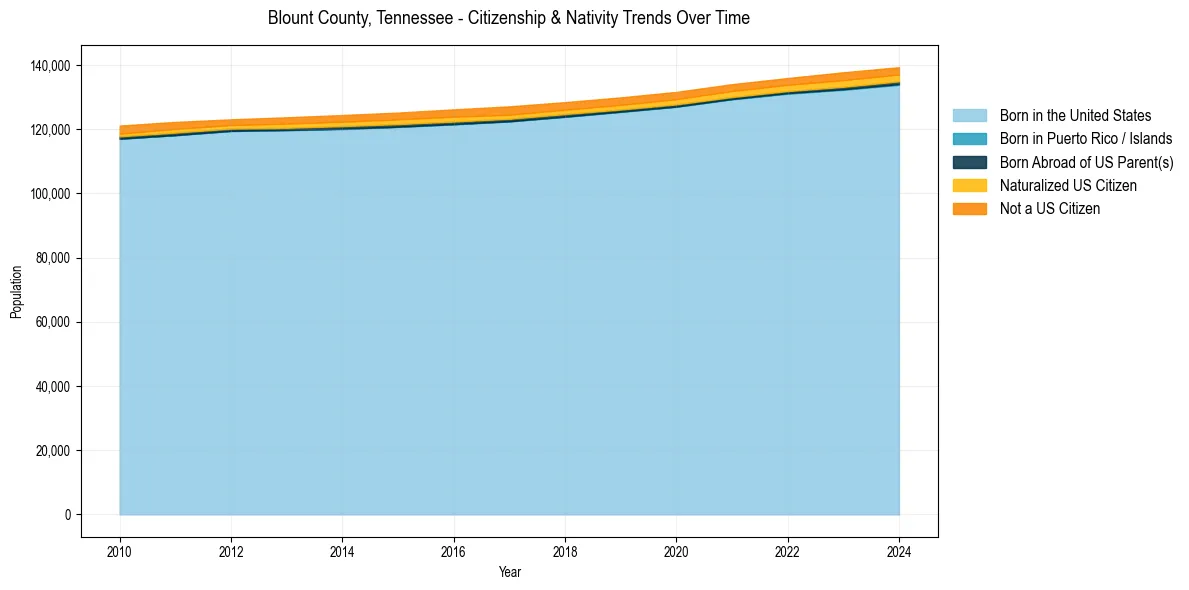
Blount County, Tennessee Population & Nativity History
| Year | Total Pop | Foreign Born | Native Born |
|---|---|---|---|
| 2024 | 139,333 | 3.2% | 96.8% |
| 2023 | 137,747 | 3.3% | 96.7% |
| 2022 | 135,951 | 3.0% | 97.0% |
| 2021 | 134,042 | 3.0% | 97.0% |
| 2020 | 131,641 | 3.0% | 97.0% |
| 2019 | 129,927 | 2.9% | 97.1% |
| 2018 | 128,443 | 2.9% | 97.1% |
| 2017 | 127,135 | 3.0% | 97.0% |
| 2016 | 126,192 | 3.0% | 97.0% |
| 2015 | 125,188 | 2.9% | 97.1% |
| 2014 | 124,435 | 2.8% | 97.2% |
| 2013 | 123,722 | 2.7% | 97.3% |
| 2012 | 123,086 | 2.3% | 97.7% |
| 2011 | 122,283 | 2.7% | 97.3% |
| 2010 | 121,140 | 2.8% | 97.2% |
Nativity & Citizenship FAQs for Blount County, Tennessee
Approximately 3.2% of residents in Blount County, Tennessee were born outside the United States.
The vast majority of residents, roughly 98.4%, are U.S. citizens (including both native-born and naturalized citizens).