Tennessee Nativity & Citizenship Status (2024)
Place of birth and citizenship status analysis for Tennessee
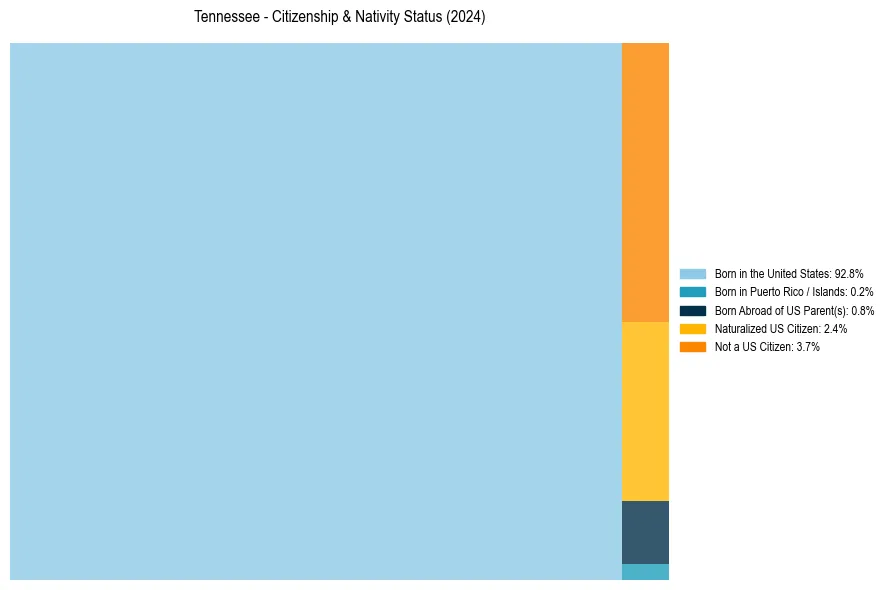
Tennessee Nativity & Citizenship Indicators (2024)
Native Born
93.9%
Foreign Born
6.1%
Naturalized
2.4%
US Citizens
96.3%
Tennessee Nativity & Citizenship Distribution
Tennessee Historical Nativity Trends (2010–2024)
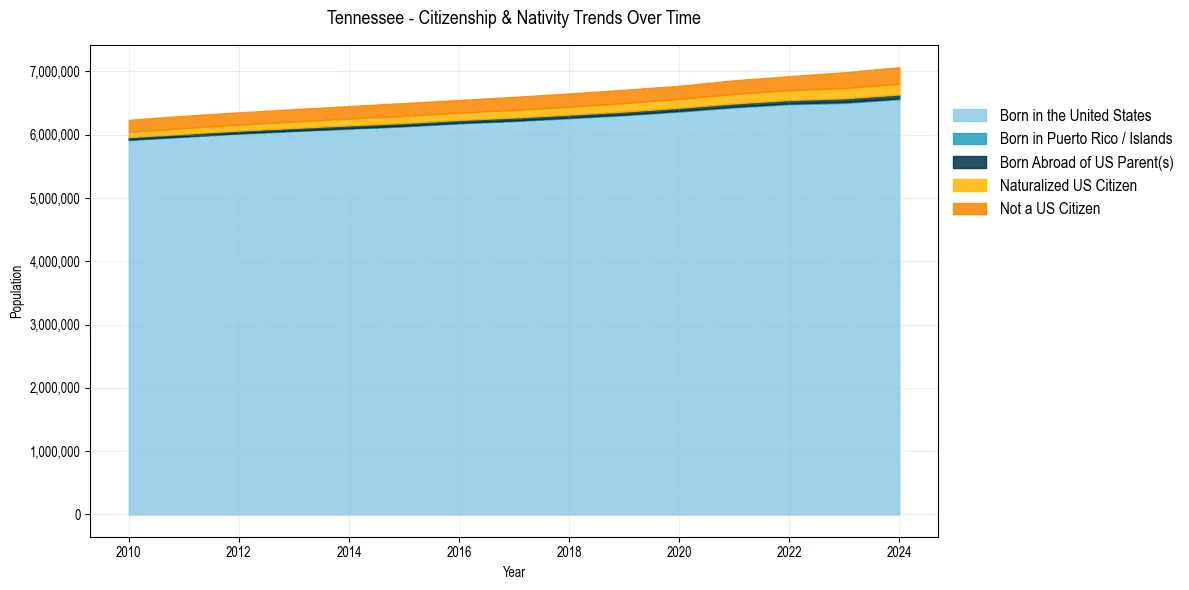
Tennessee Population & Nativity History
| Year | Total Pop | Foreign Born | Native Born |
|---|---|---|---|
| 2024 | 7,066,383 | 6.1% | 93.9% |
| 2023 | 6,986,082 | 5.9% | 94.1% |
| 2022 | 6,923,772 | 5.4% | 94.6% |
| 2021 | 6,859,497 | 5.3% | 94.7% |
| 2020 | 6,772,268 | 5.1% | 94.9% |
| 2019 | 6,709,356 | 5.1% | 94.9% |
| 2018 | 6,651,089 | 5.0% | 95.0% |
| 2017 | 6,597,381 | 5.0% | 95.0% |
| 2016 | 6,548,009 | 4.8% | 95.2% |
| 2015 | 6,499,615 | 4.8% | 95.2% |
| 2014 | 6,451,365 | 4.7% | 95.3% |
| 2013 | 6,402,387 | 4.6% | 95.4% |
| 2012 | 6,353,226 | 4.5% | 95.5% |
| 2011 | 6,297,991 | 4.5% | 95.5% |
| 2010 | 6,234,968 | 4.4% | 95.6% |
Nativity & Citizenship FAQs for Tennessee
Approximately 6.1% of residents in Tennessee were born outside the United States.
The vast majority of residents, roughly 96.3%, are U.S. citizens (including both native-born and naturalized citizens).