Rutherford County, Tennessee Nativity & Citizenship Status (2024)
Place of birth and citizenship status analysis for Rutherford County, Tennessee
Rutherford County, Tennessee Nativity & Citizenship Indicators (2024)
Native Born
89.1%
Foreign Born
10.9%
Naturalized
4.6%
US Citizens
93.7%
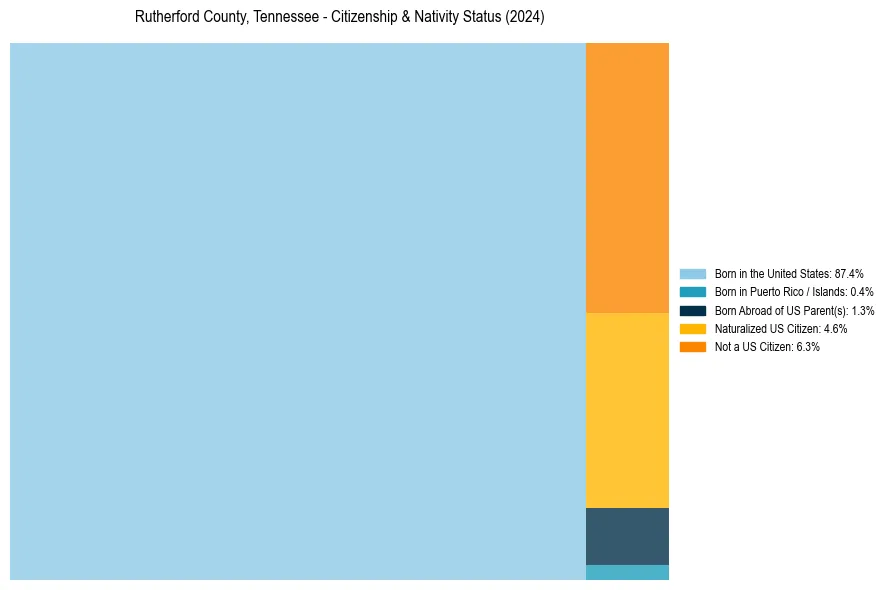
Rutherford County, Tennessee Nativity & Citizenship Distribution
Rutherford County, Tennessee Historical Nativity Trends (2010–2024)
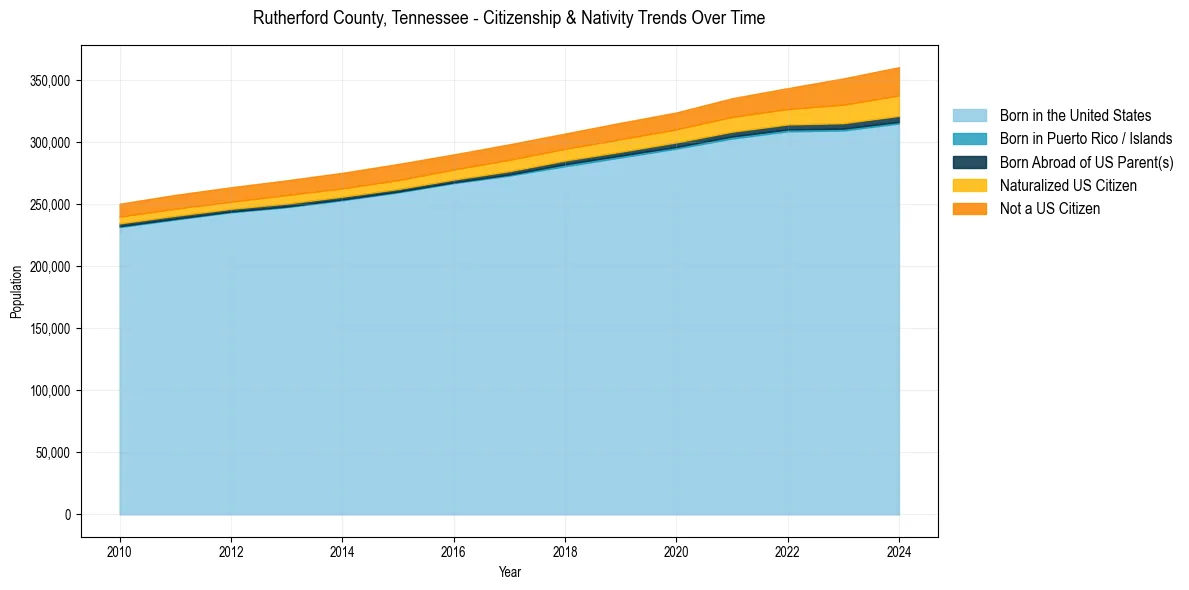
Rutherford County, Tennessee Population & Nativity History
| Year | Total Pop | Foreign Born | Native Born |
|---|---|---|---|
| 2024 | 360,646 | 10.9% | 89.1% |
| 2023 | 351,591 | 10.3% | 89.7% |
| 2022 | 343,727 | 8.5% | 91.5% |
| 2021 | 335,595 | 8.1% | 91.9% |
| 2020 | 324,139 | 7.5% | 92.5% |
| 2019 | 315,815 | 7.4% | 92.6% |
| 2018 | 307,128 | 7.1% | 92.9% |
| 2017 | 298,456 | 7.3% | 92.7% |
| 2016 | 290,289 | 7.0% | 93.0% |
| 2015 | 282,558 | 7.2% | 92.8% |
| 2014 | 275,461 | 7.0% | 93.0% |
| 2013 | 269,407 | 7.0% | 93.0% |
| 2012 | 263,815 | 6.6% | 93.4% |
| 2011 | 257,657 | 6.6% | 93.4% |
| 2010 | 250,517 | 6.3% | 93.7% |
Nativity & Citizenship FAQs for Rutherford County, Tennessee
Approximately 10.9% of residents in Rutherford County, Tennessee were born outside the United States.
The vast majority of residents, roughly 93.7%, are U.S. citizens (including both native-born and naturalized citizens).