Tennessee Commute & Transportation Patterns (2024)
Means of transportation and remote work analysis for Tennessee
Tennessee Transportation Indicators (2024)
Total Workers
3,314,309
Population 16+
driving
84.2%
Most Common Choice
Work From Home
12.9%
Remote Share
Public Transit
0.4%
Bus/Rail/Ferry
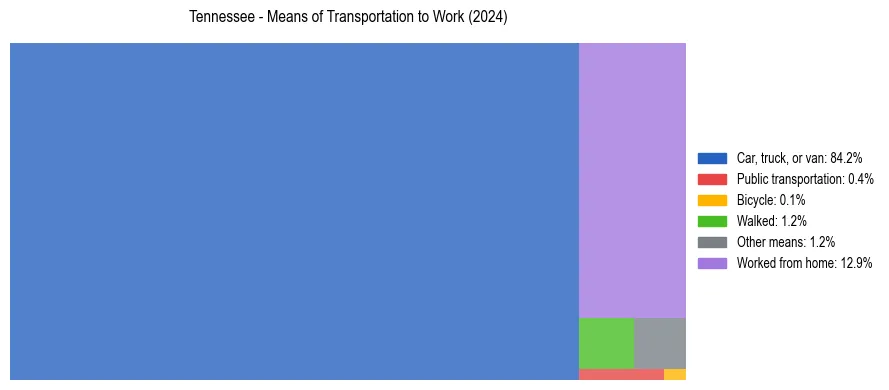
Tennessee Commute Mode Distribution
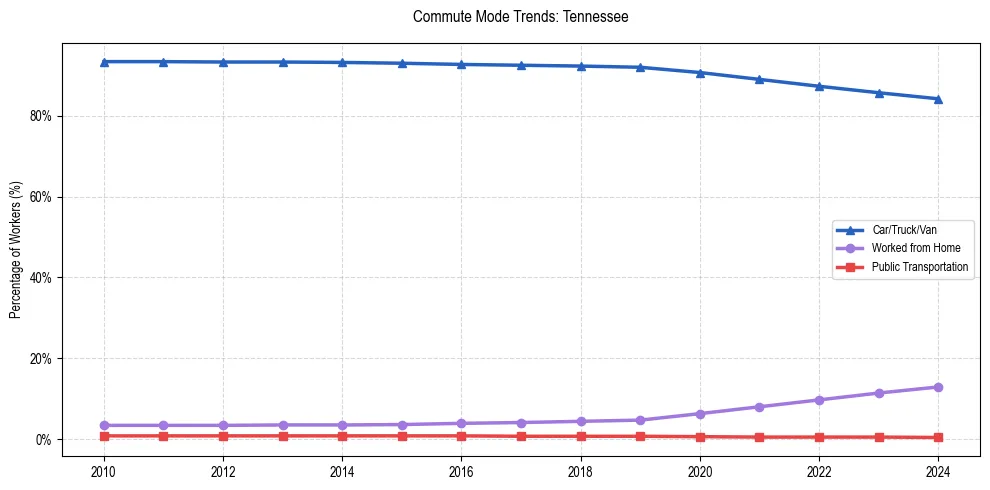
Tennessee Historical Commuting Trends
Tennessee Detailed Commute Breakdown
| Mode | Workers | Percentage |
|---|---|---|
| Car, truck, or van | 2,791,801 | 84.2% |
| Public transportation | 14,095 | 0.4% |
| Bicycle | 3,621 | 0.1% |
| Walked | 39,883 | 1.2% |
| Other means | 38,229 | 1.2% |
| Worked from home | 426,680 | 12.9% |
Commuting Patterns FAQs for Tennessee
The most common way is driving a car, truck, or van, with 84.2% of workers in Tennessee utilizing this as their primary means of transportation to work.
Since 2010, the percentage of residents working from home in Tennessee has increased significantly. Currently, 12.9% of the workforce works remotely, which is lower than the U.S. national average of 15.1%.
Approximately 12.9% of workers in Tennessee currently work remotely, compared to the national average of 15.1%.