Williamson County, Tennessee Nativity & Citizenship Status (2024)
Place of birth and citizenship status analysis for Williamson County, Tennessee
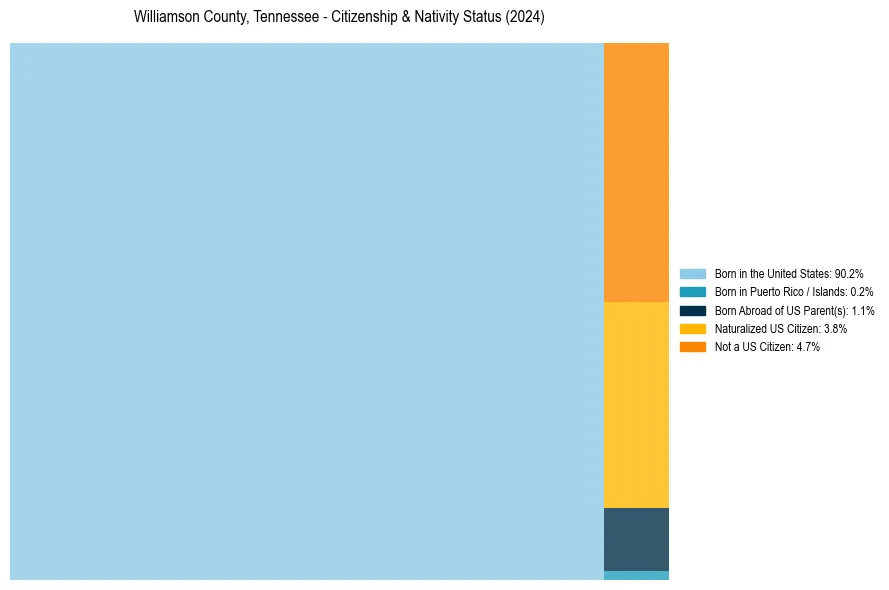
Williamson County, Tennessee Nativity & Citizenship Indicators (2024)
Native Born
91.5%
Foreign Born
8.5%
Naturalized
3.8%
US Citizens
95.3%
Williamson County, Tennessee Nativity & Citizenship Distribution
Williamson County, Tennessee Historical Nativity Trends (2010–2024)
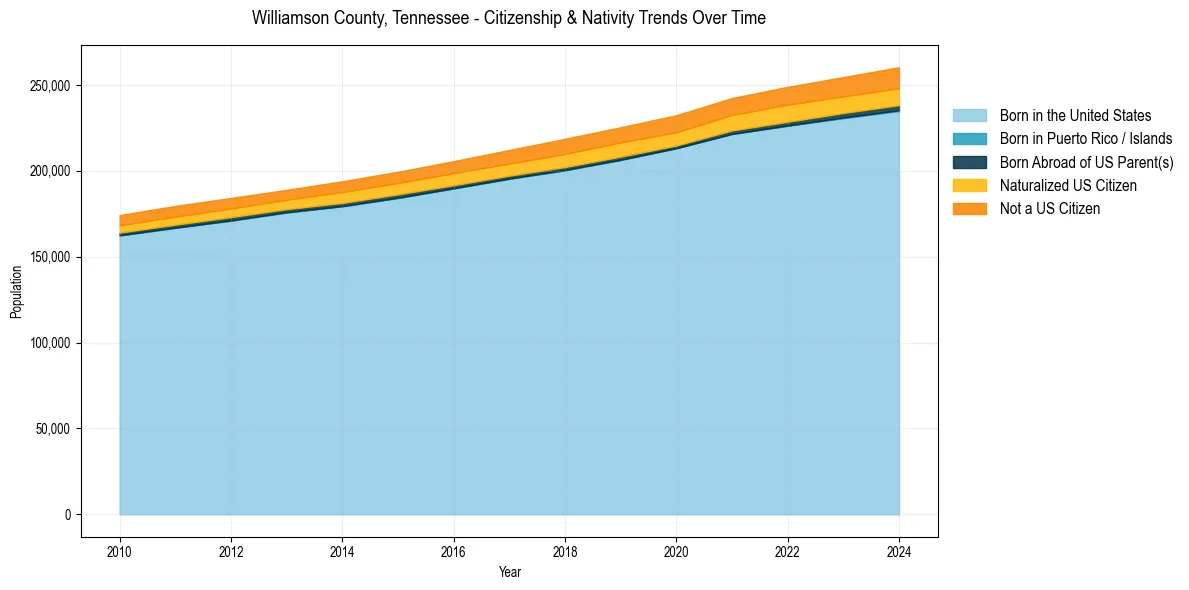
Williamson County, Tennessee Population & Nativity History
| Year | Total Pop | Foreign Born | Native Born |
|---|---|---|---|
| 2024 | 260,351 | 8.5% | 91.5% |
| 2023 | 254,609 | 8.2% | 91.8% |
| 2022 | 248,897 | 8.2% | 91.8% |
| 2021 | 242,386 | 7.8% | 92.2% |
| 2020 | 232,380 | 7.6% | 92.4% |
| 2019 | 225,389 | 7.6% | 92.4% |
| 2018 | 218,648 | 7.5% | 92.5% |
| 2017 | 212,161 | 7.1% | 92.9% |
| 2016 | 205,645 | 6.8% | 93.2% |
| 2015 | 199,456 | 6.6% | 93.4% |
| 2014 | 193,921 | 6.5% | 93.5% |
| 2013 | 188,935 | 5.9% | 94.1% |
| 2012 | 184,225 | 6.1% | 93.9% |
| 2011 | 179,601 | 6.1% | 93.9% |
| 2010 | 174,260 | 5.9% | 94.1% |
Nativity & Citizenship FAQs for Williamson County, Tennessee
Approximately 8.5% of residents in Williamson County, Tennessee were born outside the United States.
The vast majority of residents, roughly 95.3%, are U.S. citizens (including both native-born and naturalized citizens).