Texas Age & Gender Distribution (2024)
Population distribution by age and gender for Texas
Texas Age & Gender Statistics (2024)
Total Population
30,188,424
Median Age
35.6
Male Median
34.8
Female Median
36.4
Texas Population Growth
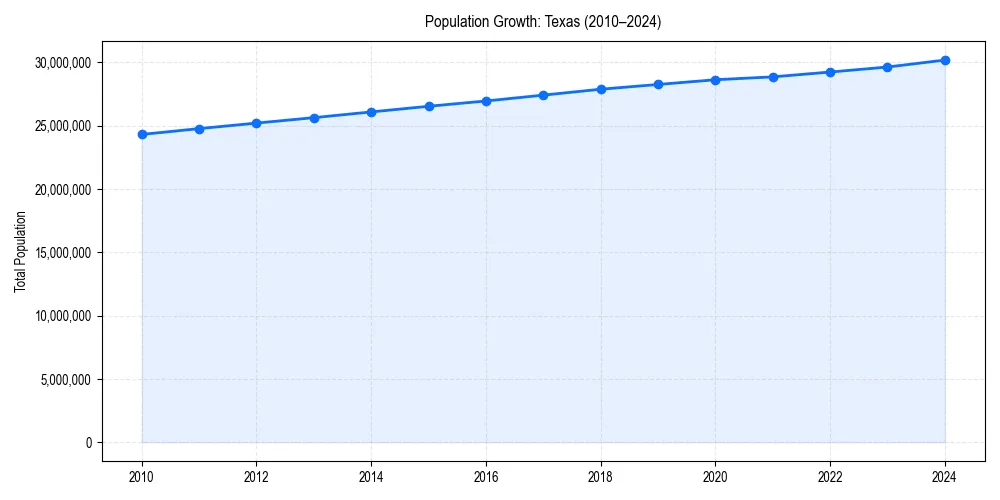
Texas Demographic Trend
Since 2010, the population of has changed by +24.2%%.
+24.2%% Growth
Texas Age & Gender Pyramid
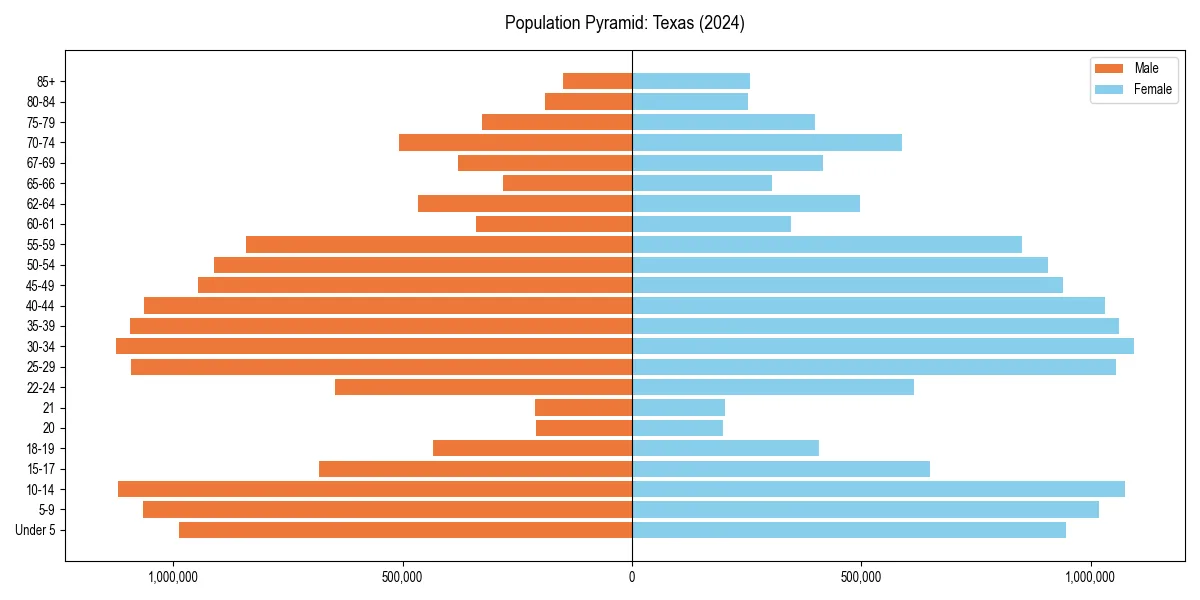
Figure 2: Population distribution by age and gender for 2024.
Texas Historical Population Data
| Year | Median Age | Population |
|---|---|---|
| 2024 | 35.6 | 30,188,424 |
| 2023 | 35.5 | 29,640,343 |
| 2022 | 35.2 | 29,243,342 |
| 2021 | 35.0 | 28,862,581 |
| 2020 | 34.8 | 28,635,442 |
| 2019 | 34.6 | 28,260,856 |
| 2018 | 34.4 | 27,885,195 |
| 2017 | 34.3 | 27,419,612 |
| 2016 | 34.2 | 26,956,435 |
| 2015 | 34.1 | 26,538,614 |
| 2014 | 33.9 | 26,092,033 |
| 2013 | 33.8 | 25,639,373 |
| 2012 | 33.6 | 25,208,897 |
| 2011 | 33.5 | 24,774,187 |
| 2010 | 33.4 | 24,311,891 |
Texas Age Group Breakdown (2024)
| Age Cohort | Percentage |
|---|---|
| Under 5 | 6.4% |
| 5–17 | 18.6% |
| 18–24 | 9.7% |
| 25–34 | 14.5% |
| 35–54 | 26.3% |
| 55–64 | 11.1% |
| 65+ | 13.4% |
Dependency Ratios for Texas
- Total Dependency Ratio:
- 62.4
- Youth Dependency:
- 40.6
- Old-Age Dependency:
- 21.8
The dependency ratio measures dependents (ages 0-17 and 65+) per 100 working-age individuals (ages 18-64).
Age & Gender FAQs for Texas
The median age in Texas is 35.6 years.
According to latest Census data, the total population of Texas is 30,188,424.
In Texas, seniors (ages 65+) make up 13.4% of the population, while children under 18 represent 18.6%.
Based on historical data since 2010, the population in Texas is aging.