Austin County, Texas Nativity & Citizenship Status (2024)
Place of birth and citizenship status analysis for Austin County, Texas
Austin County, Texas Nativity & Citizenship Indicators (2024)
Native Born
88.4%
Foreign Born
11.6%
Naturalized
4.9%
US Citizens
93.4%
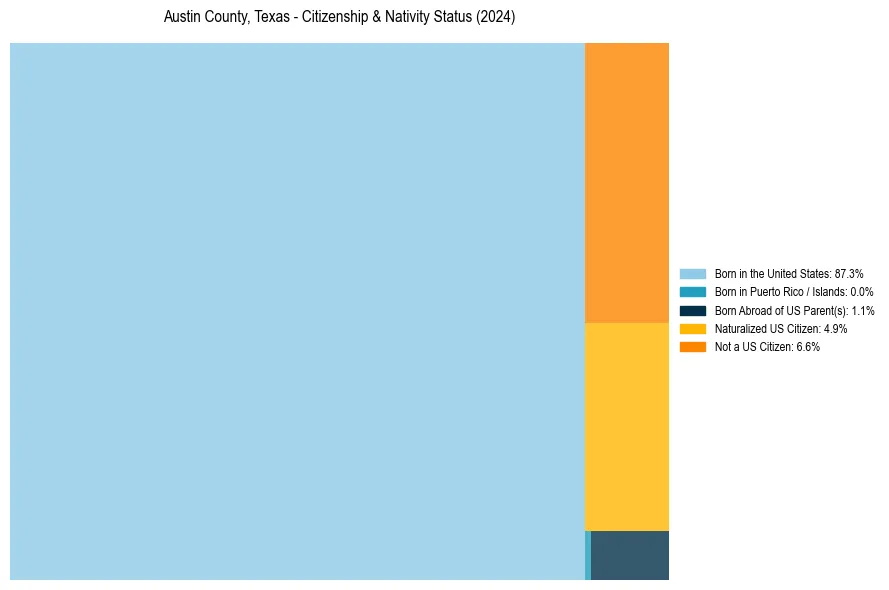
Austin County, Texas Nativity & Citizenship Distribution
Austin County, Texas Historical Nativity Trends (2010–2024)
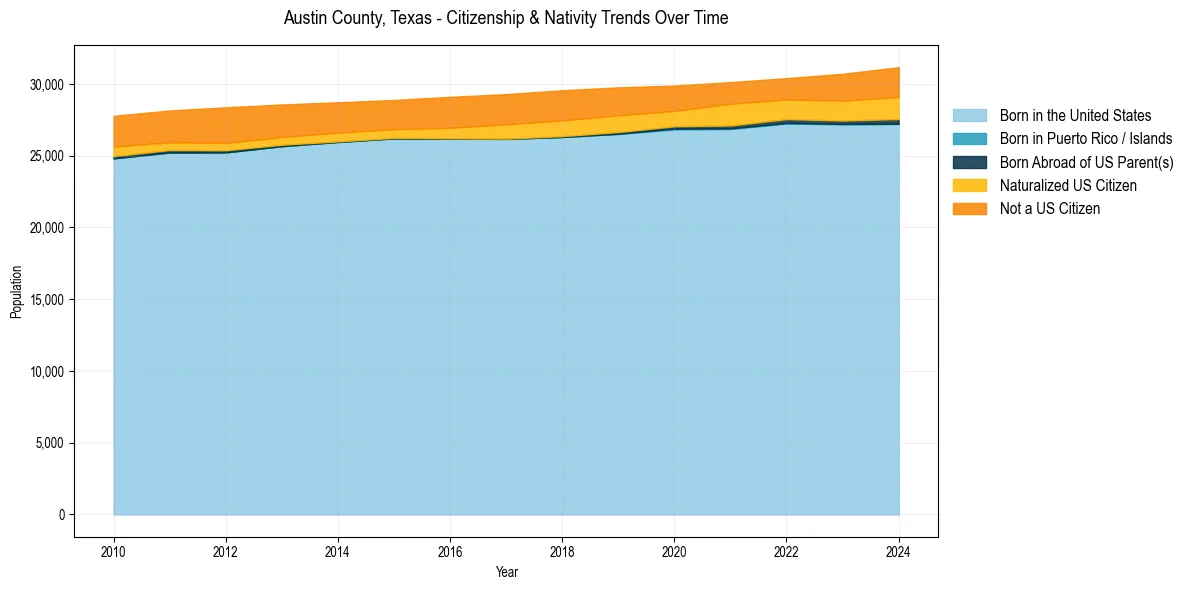
Austin County, Texas Population & Nativity History
| Year | Total Pop | Foreign Born | Native Born |
|---|---|---|---|
| 2024 | 31,170 | 11.6% | 88.4% |
| 2023 | 30,712 | 10.6% | 89.4% |
| 2022 | 30,406 | 9.4% | 90.6% |
| 2021 | 30,132 | 10.0% | 90.0% |
| 2020 | 29,892 | 9.5% | 90.5% |
| 2019 | 29,764 | 10.5% | 89.5% |
| 2018 | 29,565 | 10.8% | 89.2% |
| 2017 | 29,292 | 10.6% | 89.4% |
| 2016 | 29,107 | 9.9% | 90.1% |
| 2015 | 28,886 | 9.2% | 90.8% |
| 2014 | 28,724 | 9.5% | 90.5% |
| 2013 | 28,573 | 9.8% | 90.2% |
| 2012 | 28,372 | 10.6% | 89.4% |
| 2011 | 28,150 | 9.8% | 90.2% |
| 2010 | 27,783 | 10.1% | 89.9% |
Nativity & Citizenship FAQs for Austin County, Texas
Approximately 11.6% of residents in Austin County, Texas were born outside the United States.
The vast majority of residents, roughly 93.4%, are U.S. citizens (including both native-born and naturalized citizens).