Caldwell County, Texas Nativity & Citizenship Status (2024)
Place of birth and citizenship status analysis for Caldwell County, Texas
Caldwell County, Texas Nativity & Citizenship Indicators (2024)
Native Born
87.1%
Foreign Born
12.9%
Naturalized
3.8%
US Citizens
90.9%
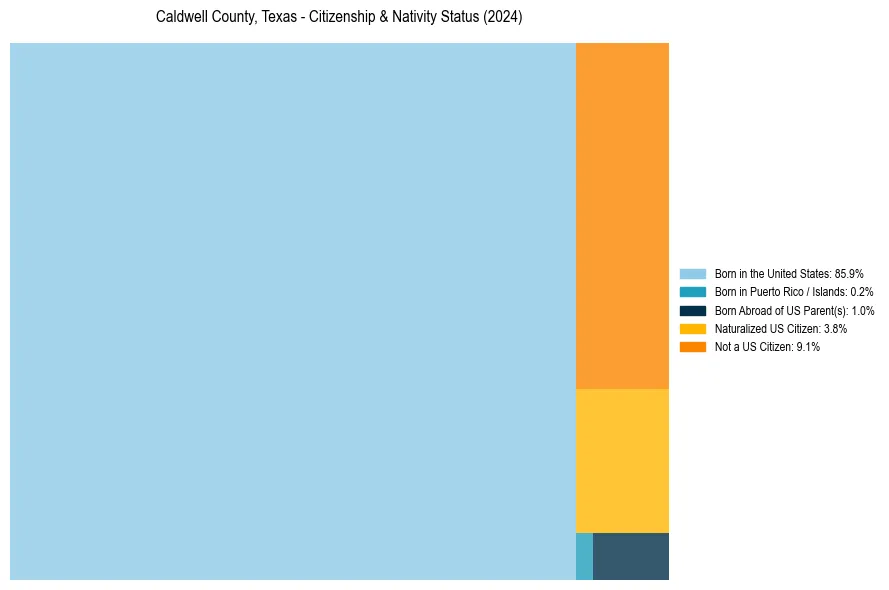
Caldwell County, Texas Nativity & Citizenship Distribution
Caldwell County, Texas Historical Nativity Trends (2010–2024)
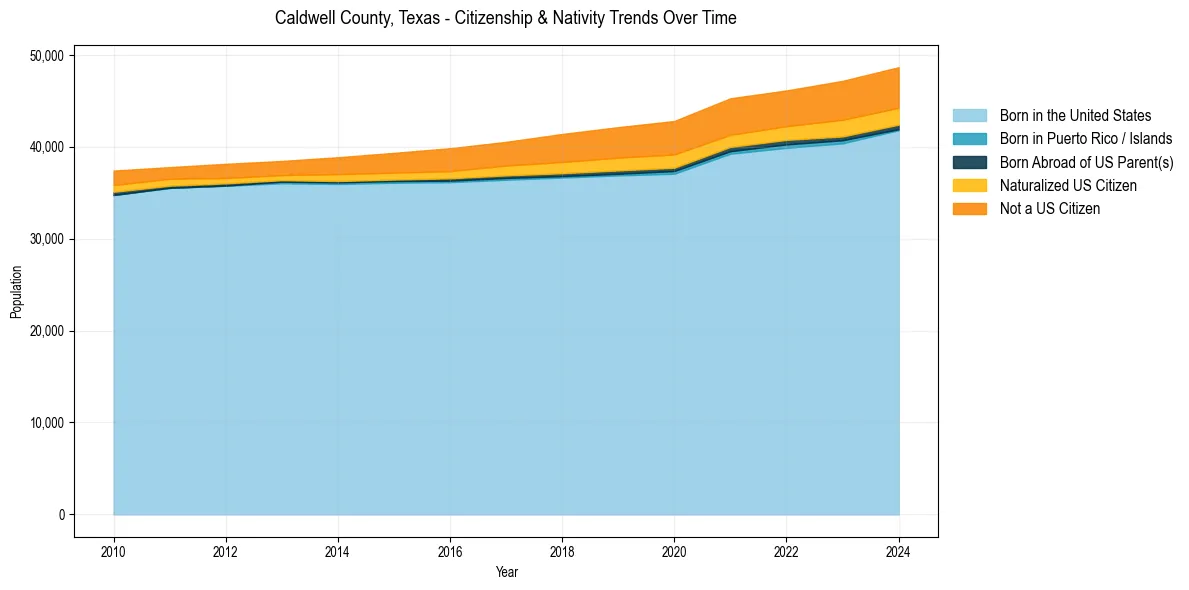
Caldwell County, Texas Population & Nativity History
| Year | Total Pop | Foreign Born | Native Born |
|---|---|---|---|
| 2024 | 48,669 | 12.9% | 87.1% |
| 2023 | 47,184 | 12.8% | 87.2% |
| 2022 | 46,141 | 11.7% | 88.3% |
| 2021 | 45,286 | 11.7% | 88.3% |
| 2020 | 42,817 | 11.9% | 88.1% |
| 2019 | 42,144 | 11.2% | 88.8% |
| 2018 | 41,401 | 10.3% | 89.7% |
| 2017 | 40,544 | 9.0% | 91.0% |
| 2016 | 39,848 | 8.2% | 91.8% |
| 2015 | 39,347 | 7.4% | 92.6% |
| 2014 | 38,870 | 6.7% | 93.3% |
| 2013 | 38,465 | 5.4% | 94.6% |
| 2012 | 38,152 | 5.6% | 94.4% |
| 2011 | 37,795 | 5.4% | 94.6% |
| 2010 | 37,416 | 6.2% | 93.8% |
Nativity & Citizenship FAQs for Caldwell County, Texas
Approximately 12.9% of residents in Caldwell County, Texas were born outside the United States.
The vast majority of residents, roughly 90.9%, are U.S. citizens (including both native-born and naturalized citizens).