Calhoun County, Texas Nativity & Citizenship Status (2024)
Place of birth and citizenship status analysis for Calhoun County, Texas
Calhoun County, Texas Nativity & Citizenship Indicators (2024)
Native Born
90.8%
Foreign Born
9.2%
Naturalized
4.2%
US Citizens
94.9%
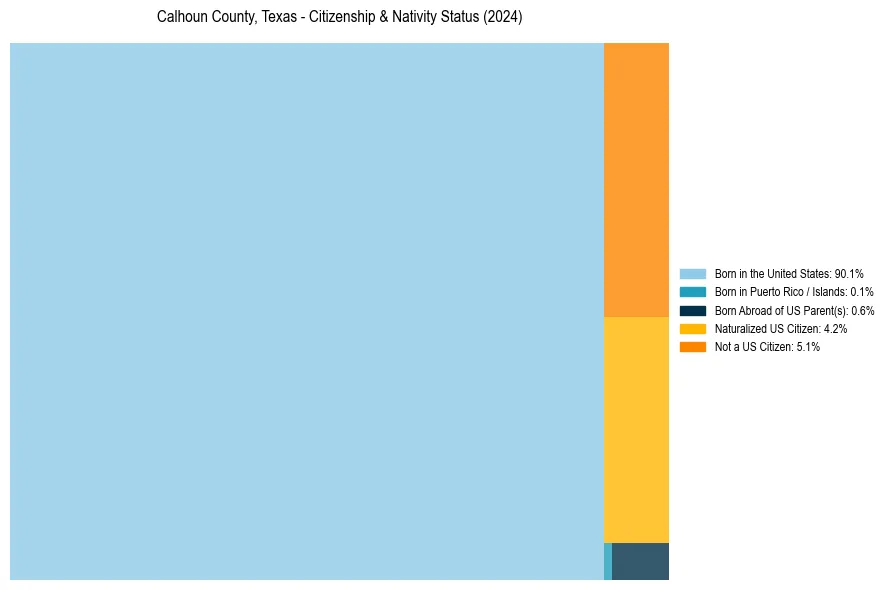
Calhoun County, Texas Nativity & Citizenship Distribution
Calhoun County, Texas Historical Nativity Trends (2010–2024)
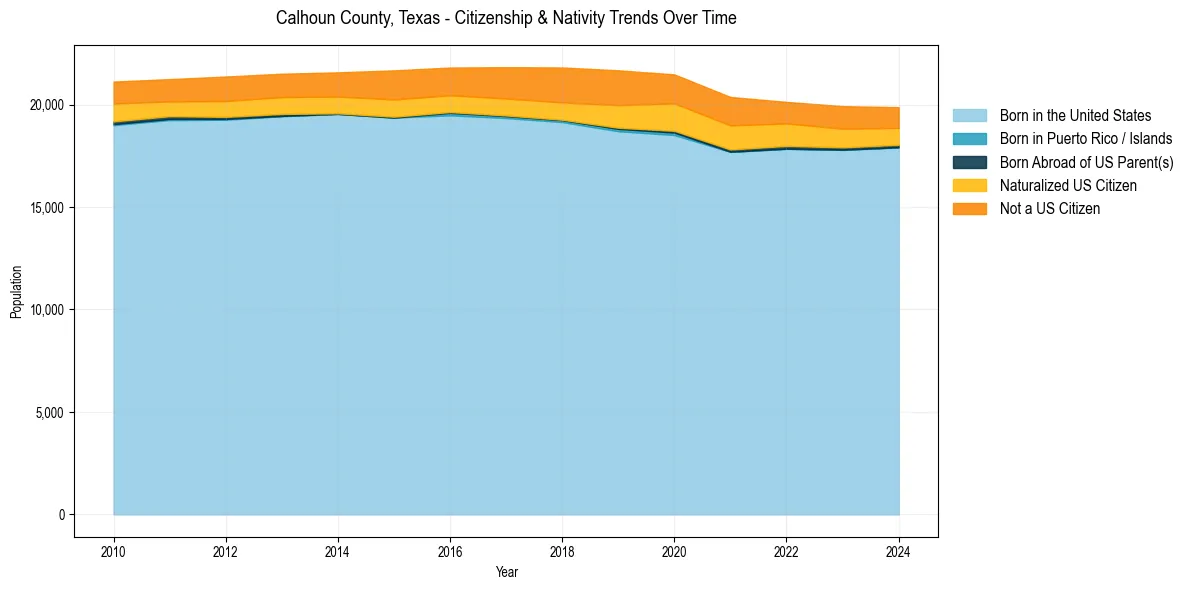
Calhoun County, Texas Population & Nativity History
| Year | Total Pop | Foreign Born | Native Born |
|---|---|---|---|
| 2024 | 19,868 | 9.2% | 90.8% |
| 2023 | 19,921 | 10.1% | 89.9% |
| 2022 | 20,127 | 10.7% | 89.3% |
| 2021 | 20,367 | 12.6% | 87.4% |
| 2020 | 21,470 | 12.8% | 87.2% |
| 2019 | 21,668 | 12.9% | 87.1% |
| 2018 | 21,807 | 11.7% | 88.3% |
| 2017 | 21,821 | 10.8% | 89.2% |
| 2016 | 21,805 | 10.0% | 90.0% |
| 2015 | 21,666 | 10.4% | 89.6% |
| 2014 | 21,569 | 9.3% | 90.7% |
| 2013 | 21,503 | 9.1% | 90.9% |
| 2012 | 21,366 | 9.2% | 90.8% |
| 2011 | 21,240 | 8.5% | 91.5% |
| 2010 | 21,120 | 9.2% | 90.8% |
Nativity & Citizenship FAQs for Calhoun County, Texas
Approximately 9.2% of residents in Calhoun County, Texas were born outside the United States.
The vast majority of residents, roughly 94.9%, are U.S. citizens (including both native-born and naturalized citizens).