Chambers County, Texas Nativity & Citizenship Status (2024)
Place of birth and citizenship status analysis for Chambers County, Texas
Chambers County, Texas Nativity & Citizenship Indicators (2024)
Native Born
90.4%
Foreign Born
9.6%
Naturalized
4.1%
US Citizens
94.5%
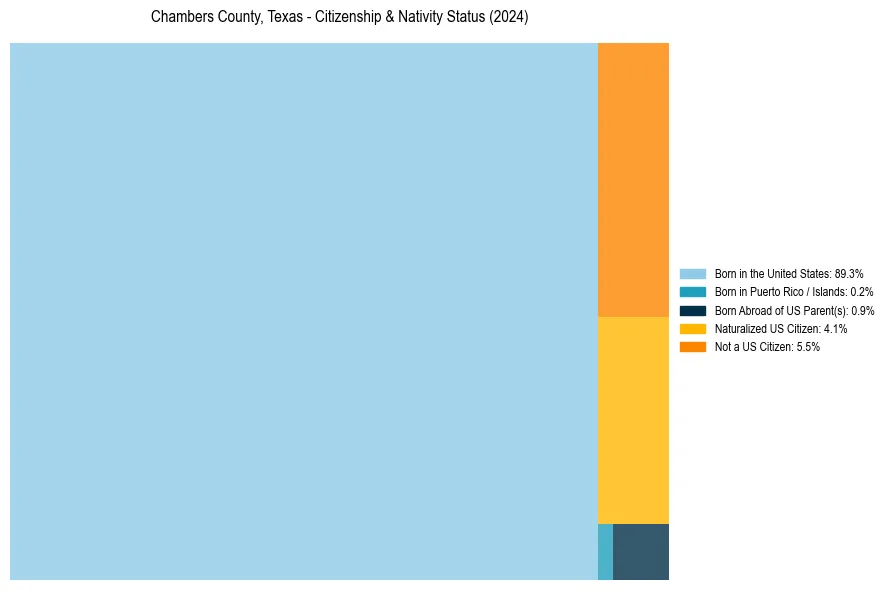
Chambers County, Texas Nativity & Citizenship Distribution
Chambers County, Texas Historical Nativity Trends (2010–2024)
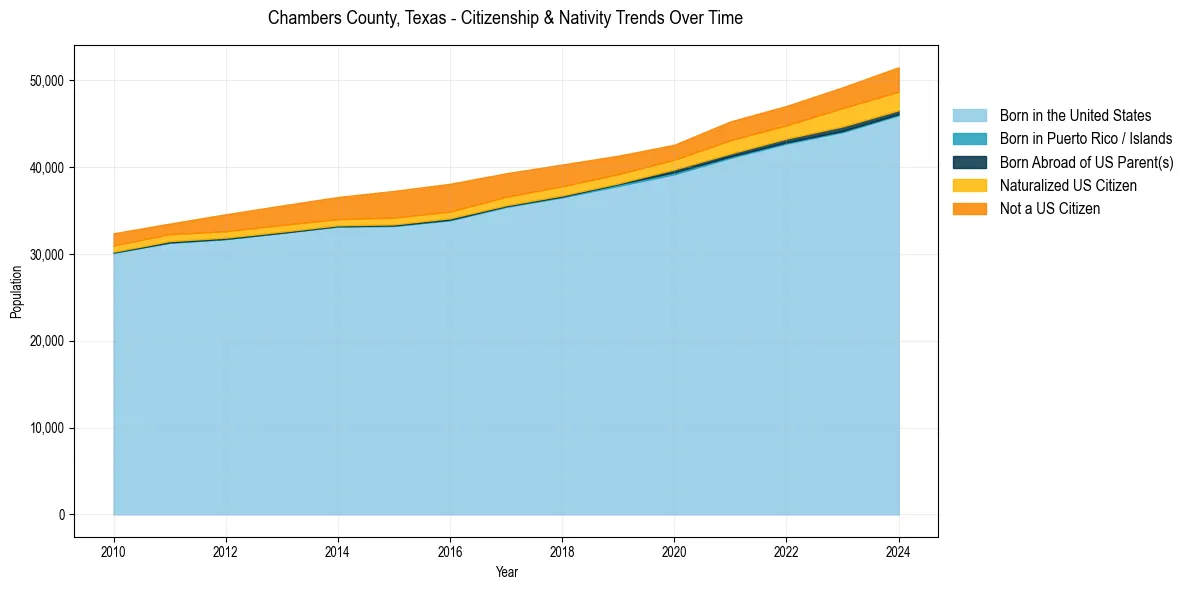
Chambers County, Texas Population & Nativity History
| Year | Total Pop | Foreign Born | Native Born |
|---|---|---|---|
| 2024 | 51,498 | 9.6% | 90.4% |
| 2023 | 49,178 | 9.2% | 90.8% |
| 2022 | 47,037 | 8.0% | 92.0% |
| 2021 | 45,257 | 8.2% | 91.8% |
| 2020 | 42,571 | 6.7% | 93.3% |
| 2019 | 41,305 | 7.7% | 92.3% |
| 2018 | 40,292 | 8.9% | 91.1% |
| 2017 | 39,283 | 9.4% | 90.6% |
| 2016 | 38,072 | 10.5% | 89.5% |
| 2015 | 37,251 | 10.4% | 89.6% |
| 2014 | 36,550 | 8.9% | 91.1% |
| 2013 | 35,570 | 8.5% | 91.5% |
| 2012 | 34,562 | 7.8% | 92.2% |
| 2011 | 33,486 | 6.1% | 93.9% |
| 2010 | 32,371 | 6.6% | 93.4% |
Nativity & Citizenship FAQs for Chambers County, Texas
Approximately 9.6% of residents in Chambers County, Texas were born outside the United States.
The vast majority of residents, roughly 94.5%, are U.S. citizens (including both native-born and naturalized citizens).