Cherokee County, Texas Nativity & Citizenship Status (2024)
Place of birth and citizenship status analysis for Cherokee County, Texas
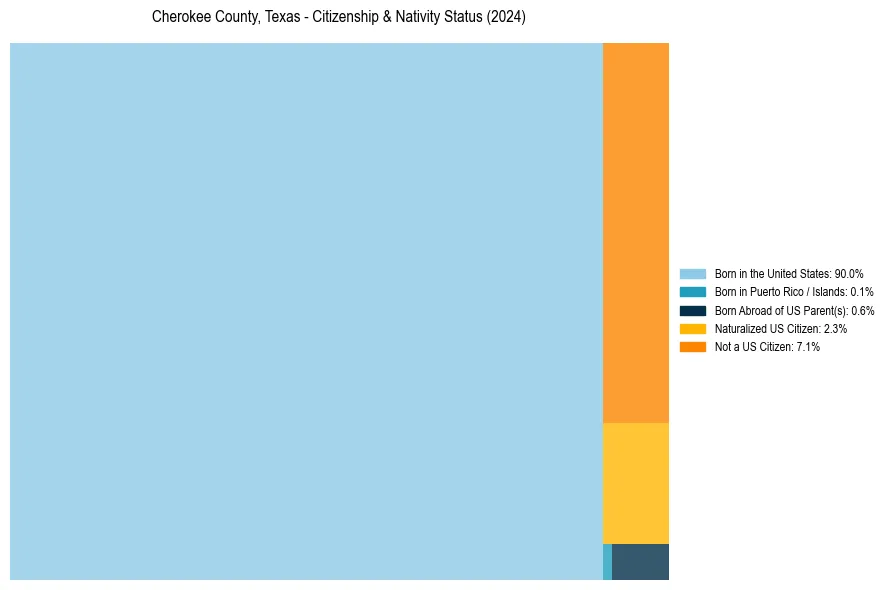
Cherokee County, Texas Nativity & Citizenship Indicators (2024)
Native Born
90.6%
Foreign Born
9.4%
Naturalized
2.3%
US Citizens
92.9%
Cherokee County, Texas Nativity & Citizenship Distribution
Cherokee County, Texas Historical Nativity Trends (2010–2024)
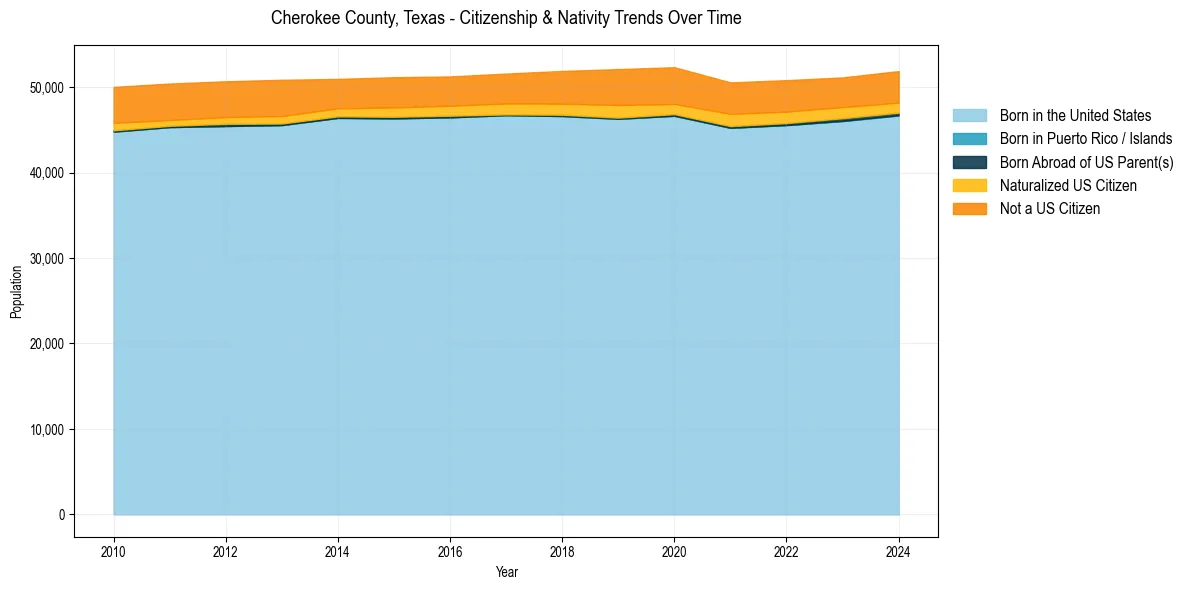
Cherokee County, Texas Population & Nativity History
| Year | Total Pop | Foreign Born | Native Born |
|---|---|---|---|
| 2024 | 51,886 | 9.4% | 90.6% |
| 2023 | 51,143 | 9.3% | 90.7% |
| 2022 | 50,824 | 9.9% | 90.1% |
| 2021 | 50,564 | 10.1% | 89.9% |
| 2020 | 52,341 | 10.5% | 89.5% |
| 2019 | 52,118 | 10.9% | 89.1% |
| 2018 | 51,903 | 9.9% | 90.1% |
| 2017 | 51,594 | 9.3% | 90.7% |
| 2016 | 51,257 | 9.0% | 91.0% |
| 2015 | 51,167 | 9.1% | 90.9% |
| 2014 | 50,971 | 8.6% | 91.4% |
| 2013 | 50,865 | 10.1% | 89.9% |
| 2012 | 50,690 | 9.8% | 90.2% |
| 2011 | 50,427 | 9.8% | 90.2% |
| 2010 | 50,035 | 10.2% | 89.8% |
Nativity & Citizenship FAQs for Cherokee County, Texas
Approximately 9.4% of residents in Cherokee County, Texas were born outside the United States.
The vast majority of residents, roughly 92.9%, are U.S. citizens (including both native-born and naturalized citizens).