Concho County, Texas Nativity & Citizenship Status (2024)
Place of birth and citizenship status analysis for Concho County, Texas
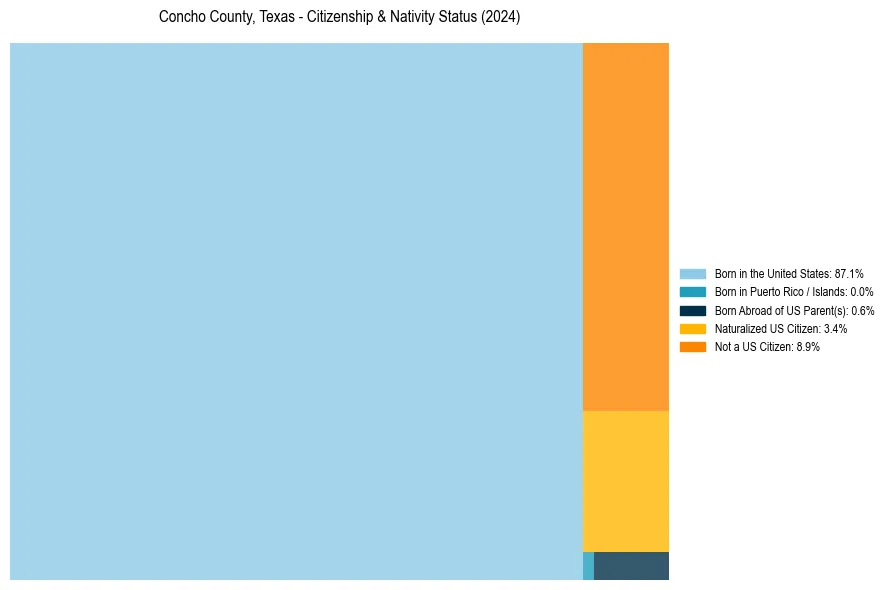
Concho County, Texas Nativity & Citizenship Indicators (2024)
Native Born
87.7%
Foreign Born
12.3%
Naturalized
3.4%
US Citizens
91.1%
Concho County, Texas Nativity & Citizenship Distribution
Concho County, Texas Historical Nativity Trends (2010–2024)
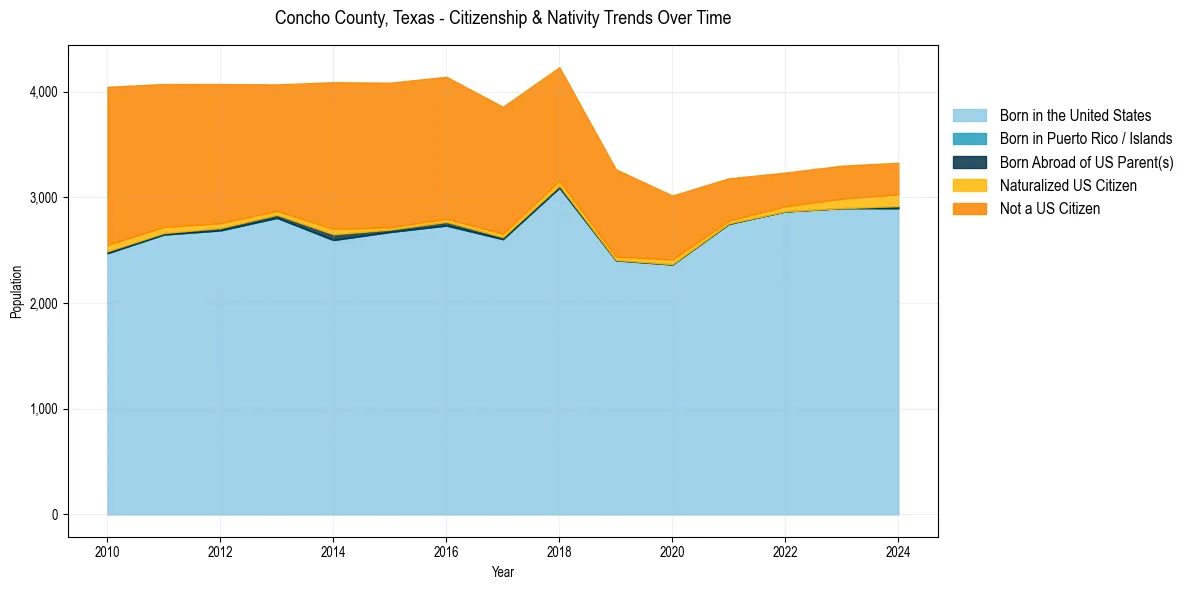
Concho County, Texas Population & Nativity History
| Year | Total Pop | Foreign Born | Native Born |
|---|---|---|---|
| 2024 | 3,328 | 12.3% | 87.7% |
| 2023 | 3,301 | 12.2% | 87.8% |
| 2022 | 3,235 | 11.3% | 88.7% |
| 2021 | 3,181 | 13.4% | 86.6% |
| 2020 | 3,018 | 21.5% | 78.5% |
| 2019 | 3,266 | 26.3% | 73.7% |
| 2018 | 4,233 | 26.5% | 73.5% |
| 2017 | 3,858 | 32.0% | 68.0% |
| 2016 | 4,142 | 33.2% | 66.8% |
| 2015 | 4,086 | 34.0% | 66.0% |
| 2014 | 4,091 | 35.2% | 64.8% |
| 2013 | 4,070 | 30.3% | 69.7% |
| 2012 | 4,073 | 33.5% | 66.5% |
| 2011 | 4,074 | 34.6% | 65.4% |
| 2010 | 4,047 | 38.5% | 61.5% |
Nativity & Citizenship FAQs for Concho County, Texas
Approximately 12.3% of residents in Concho County, Texas were born outside the United States.
The vast majority of residents, roughly 91.1%, are U.S. citizens (including both native-born and naturalized citizens).