Fayette County, Texas Nativity & Citizenship Status (2024)
Place of birth and citizenship status analysis for Fayette County, Texas
Fayette County, Texas Nativity & Citizenship Indicators (2024)
Native Born
93.7%
Foreign Born
6.3%
Naturalized
2.4%
US Citizens
96.1%
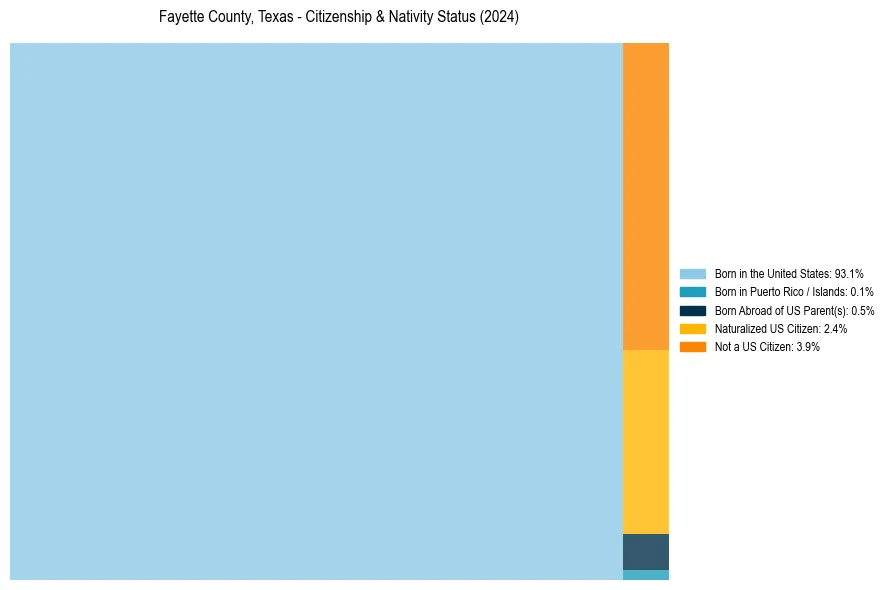
Fayette County, Texas Nativity & Citizenship Distribution
Fayette County, Texas Historical Nativity Trends (2010–2024)
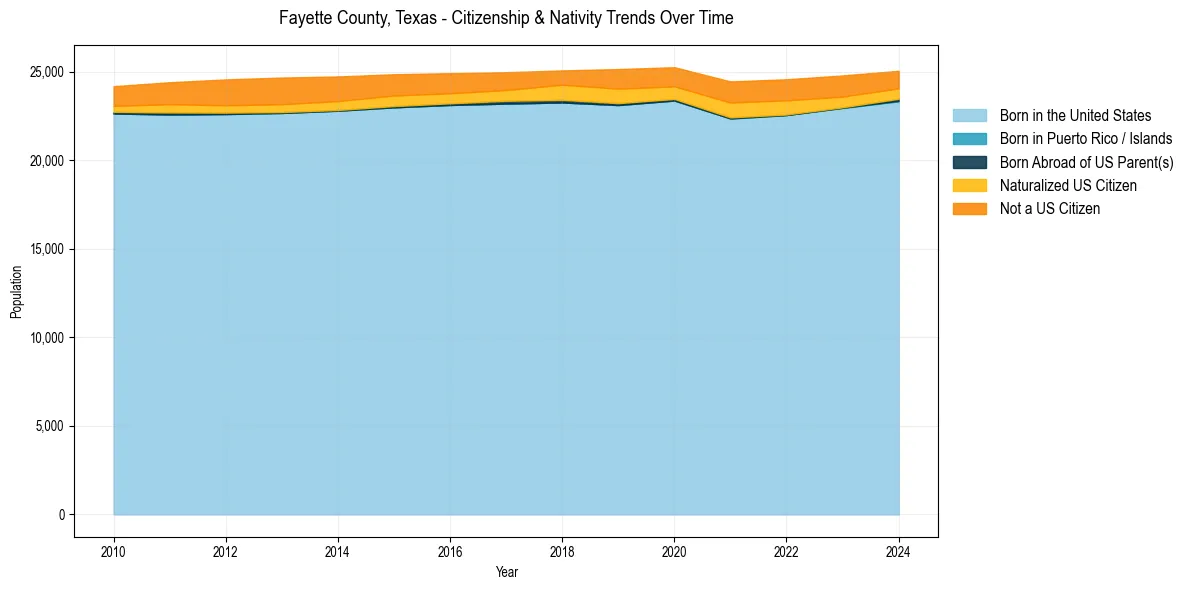
Fayette County, Texas Population & Nativity History
| Year | Total Pop | Foreign Born | Native Born |
|---|---|---|---|
| 2024 | 25,042 | 6.3% | 93.7% |
| 2023 | 24,783 | 7.3% | 92.7% |
| 2022 | 24,564 | 8.1% | 91.9% |
| 2021 | 24,445 | 8.3% | 91.7% |
| 2020 | 25,247 | 7.1% | 92.9% |
| 2019 | 25,141 | 7.6% | 92.4% |
| 2018 | 25,066 | 6.6% | 93.4% |
| 2017 | 24,963 | 6.5% | 93.5% |
| 2016 | 24,909 | 6.8% | 93.2% |
| 2015 | 24,849 | 7.2% | 92.8% |
| 2014 | 24,725 | 7.7% | 92.3% |
| 2013 | 24,662 | 7.9% | 92.1% |
| 2012 | 24,557 | 7.6% | 92.4% |
| 2011 | 24,397 | 7.0% | 93.0% |
| 2010 | 24,175 | 6.0% | 94.0% |
Nativity & Citizenship FAQs for Fayette County, Texas
Approximately 6.3% of residents in Fayette County, Texas were born outside the United States.
The vast majority of residents, roughly 96.1%, are U.S. citizens (including both native-born and naturalized citizens).