Gillespie County, Texas Nativity & Citizenship Status (2024)
Place of birth and citizenship status analysis for Gillespie County, Texas
Gillespie County, Texas Nativity & Citizenship Indicators (2024)
Native Born
94.0%
Foreign Born
6.0%
Naturalized
2.4%
US Citizens
96.4%
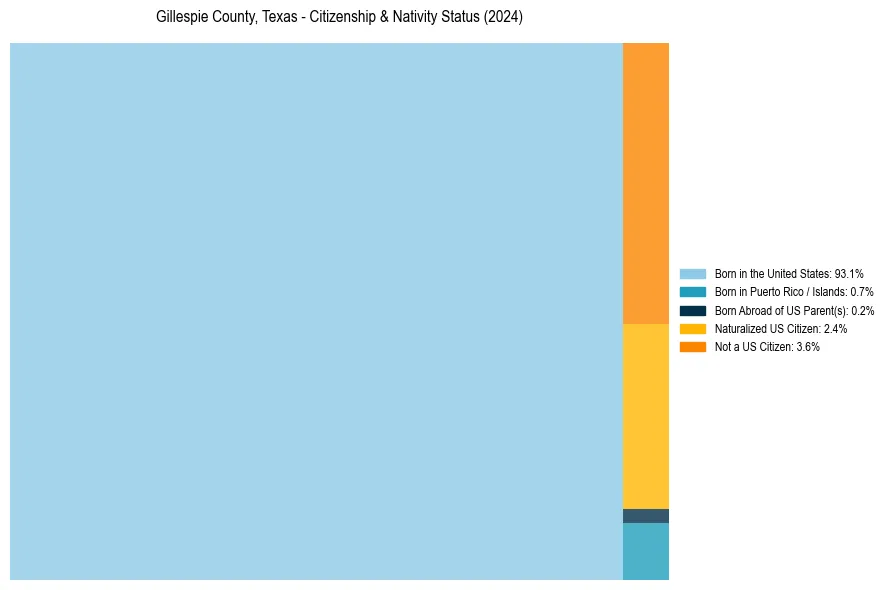
Gillespie County, Texas Nativity & Citizenship Distribution
Gillespie County, Texas Historical Nativity Trends (2010–2024)
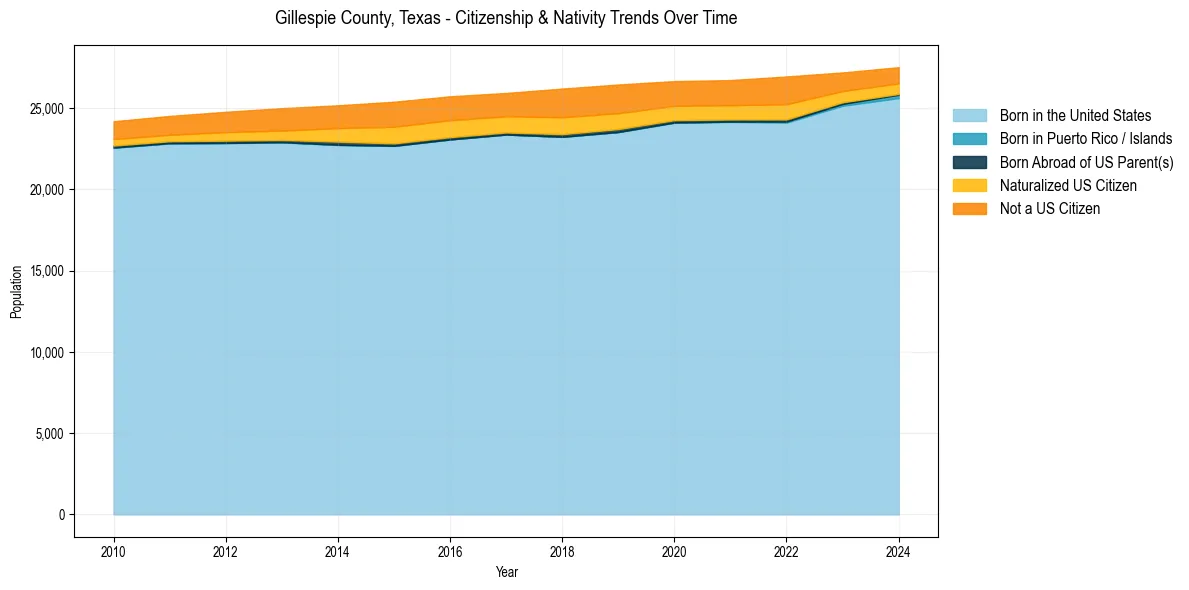
Gillespie County, Texas Population & Nativity History
| Year | Total Pop | Foreign Born | Native Born |
|---|---|---|---|
| 2024 | 27,524 | 6.0% | 94.0% |
| 2023 | 27,202 | 6.8% | 93.2% |
| 2022 | 26,953 | 9.8% | 90.2% |
| 2021 | 26,730 | 9.1% | 90.9% |
| 2020 | 26,668 | 9.0% | 91.0% |
| 2019 | 26,459 | 10.4% | 89.6% |
| 2018 | 26,208 | 10.7% | 89.3% |
| 2017 | 25,939 | 9.4% | 90.6% |
| 2016 | 25,732 | 9.8% | 90.2% |
| 2015 | 25,398 | 10.1% | 89.9% |
| 2014 | 25,179 | 8.9% | 91.1% |
| 2013 | 25,003 | 7.8% | 92.2% |
| 2012 | 24,777 | 7.2% | 92.8% |
| 2011 | 24,524 | 6.3% | 93.7% |
| 2010 | 24,197 | 6.2% | 93.8% |
Nativity & Citizenship FAQs for Gillespie County, Texas
Approximately 6.0% of residents in Gillespie County, Texas were born outside the United States.
The vast majority of residents, roughly 96.4%, are U.S. citizens (including both native-born and naturalized citizens).