Glasscock County, Texas Nativity & Citizenship Status (2024)
Place of birth and citizenship status analysis for Glasscock County, Texas
Glasscock County, Texas Nativity & Citizenship Indicators (2024)
Native Born
89.9%
Foreign Born
10.1%
Naturalized
1.8%
US Citizens
91.7%
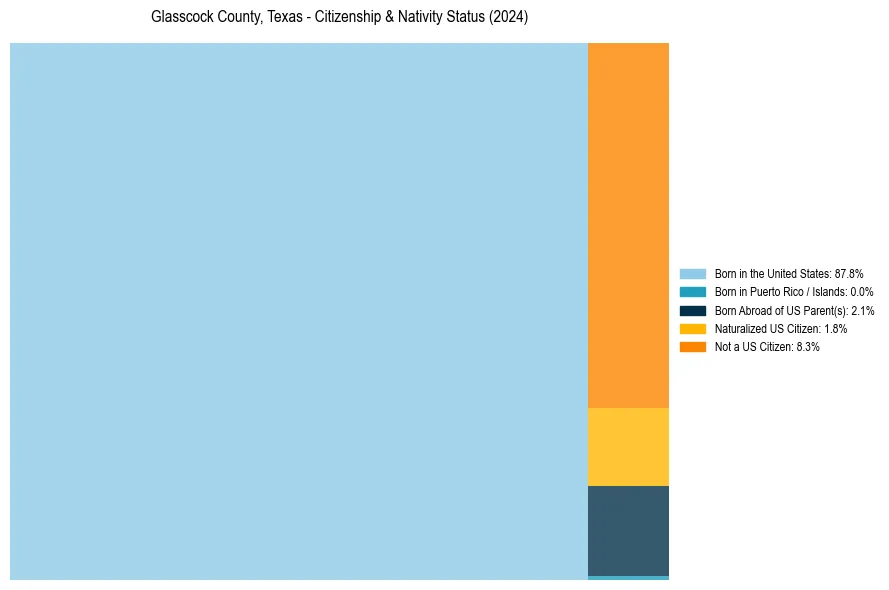
Glasscock County, Texas Nativity & Citizenship Distribution
Glasscock County, Texas Historical Nativity Trends (2010–2024)
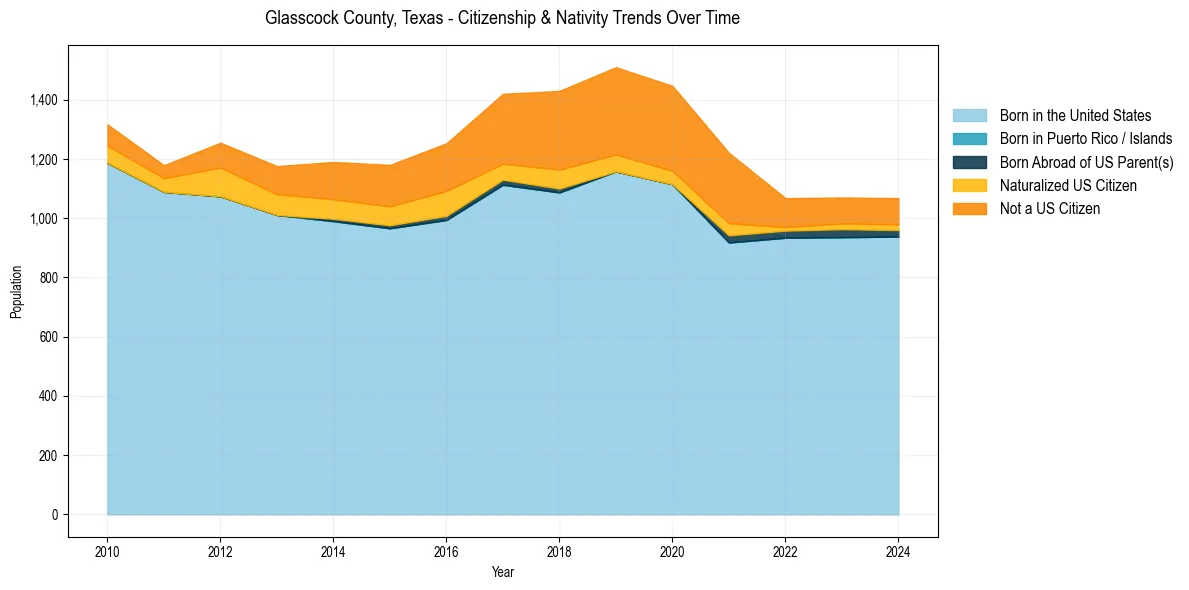
Glasscock County, Texas Population & Nativity History
| Year | Total Pop | Foreign Born | Native Born |
|---|---|---|---|
| 2024 | 1,068 | 10.1% | 89.9% |
| 2023 | 1,070 | 10.0% | 90.0% |
| 2022 | 1,068 | 10.3% | 89.7% |
| 2021 | 1,221 | 22.9% | 77.1% |
| 2020 | 1,447 | 22.9% | 77.1% |
| 2019 | 1,510 | 23.3% | 76.7% |
| 2018 | 1,430 | 23.1% | 76.9% |
| 2017 | 1,420 | 20.4% | 79.6% |
| 2016 | 1,253 | 19.6% | 80.4% |
| 2015 | 1,180 | 17.3% | 82.7% |
| 2014 | 1,190 | 16.1% | 83.9% |
| 2013 | 1,176 | 14.0% | 86.0% |
| 2012 | 1,255 | 14.4% | 85.6% |
| 2011 | 1,179 | 7.6% | 92.4% |
| 2010 | 1,317 | 9.9% | 90.1% |
Nativity & Citizenship FAQs for Glasscock County, Texas
Approximately 10.1% of residents in Glasscock County, Texas were born outside the United States.
The vast majority of residents, roughly 91.7%, are U.S. citizens (including both native-born and naturalized citizens).