Hopkins County, Texas Nativity & Citizenship Status (2024)
Place of birth and citizenship status analysis for Hopkins County, Texas
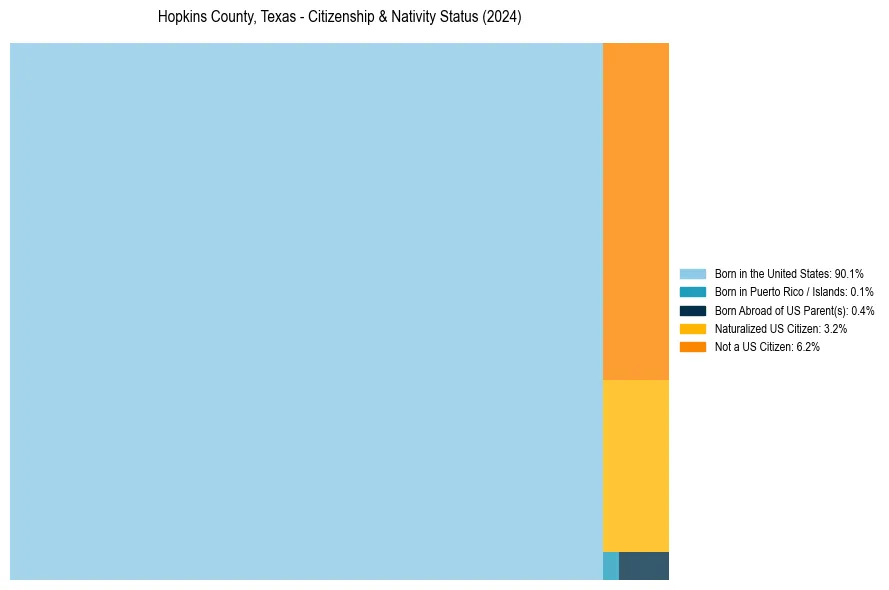
Hopkins County, Texas Nativity & Citizenship Indicators (2024)
Native Born
90.6%
Foreign Born
9.4%
Naturalized
3.2%
US Citizens
93.8%
Hopkins County, Texas Nativity & Citizenship Distribution
Hopkins County, Texas Historical Nativity Trends (2010–2024)
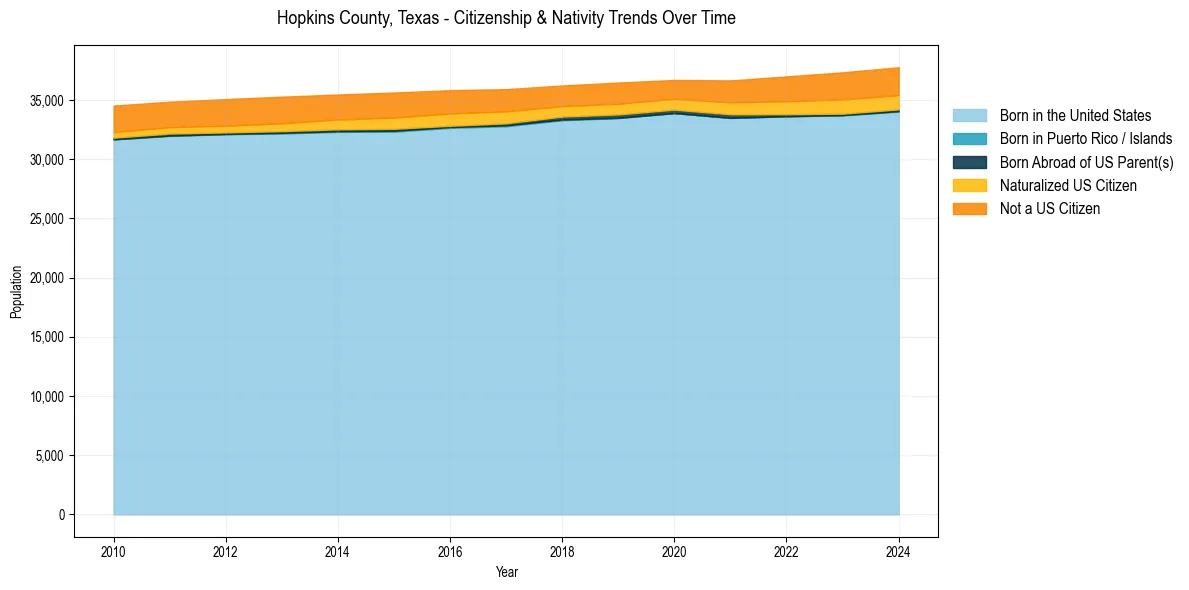
Hopkins County, Texas Population & Nativity History
| Year | Total Pop | Foreign Born | Native Born |
|---|---|---|---|
| 2024 | 37,784 | 9.4% | 90.6% |
| 2023 | 37,351 | 9.4% | 90.6% |
| 2022 | 37,008 | 8.6% | 91.4% |
| 2021 | 36,666 | 7.8% | 92.2% |
| 2020 | 36,708 | 6.8% | 93.2% |
| 2019 | 36,486 | 7.4% | 92.6% |
| 2018 | 36,240 | 7.3% | 92.7% |
| 2017 | 35,929 | 8.0% | 92.0% |
| 2016 | 35,844 | 8.4% | 91.6% |
| 2015 | 35,645 | 8.6% | 91.4% |
| 2014 | 35,478 | 8.3% | 91.7% |
| 2013 | 35,295 | 8.3% | 91.7% |
| 2012 | 35,088 | 8.0% | 92.0% |
| 2011 | 34,869 | 7.7% | 92.3% |
| 2010 | 34,540 | 7.9% | 92.1% |
Nativity & Citizenship FAQs for Hopkins County, Texas
Approximately 9.4% of residents in Hopkins County, Texas were born outside the United States.
The vast majority of residents, roughly 93.8%, are U.S. citizens (including both native-born and naturalized citizens).