Howard County, Texas Nativity & Citizenship Status (2024)
Place of birth and citizenship status analysis for Howard County, Texas
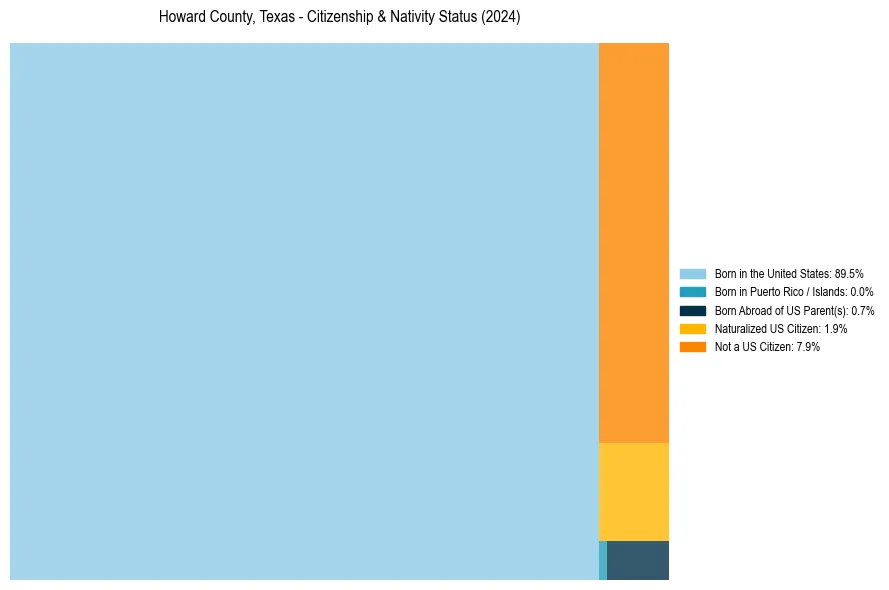
Howard County, Texas Nativity & Citizenship Indicators (2024)
Native Born
90.2%
Foreign Born
9.8%
Naturalized
1.9%
US Citizens
92.1%
Howard County, Texas Nativity & Citizenship Distribution
Howard County, Texas Historical Nativity Trends (2010–2024)
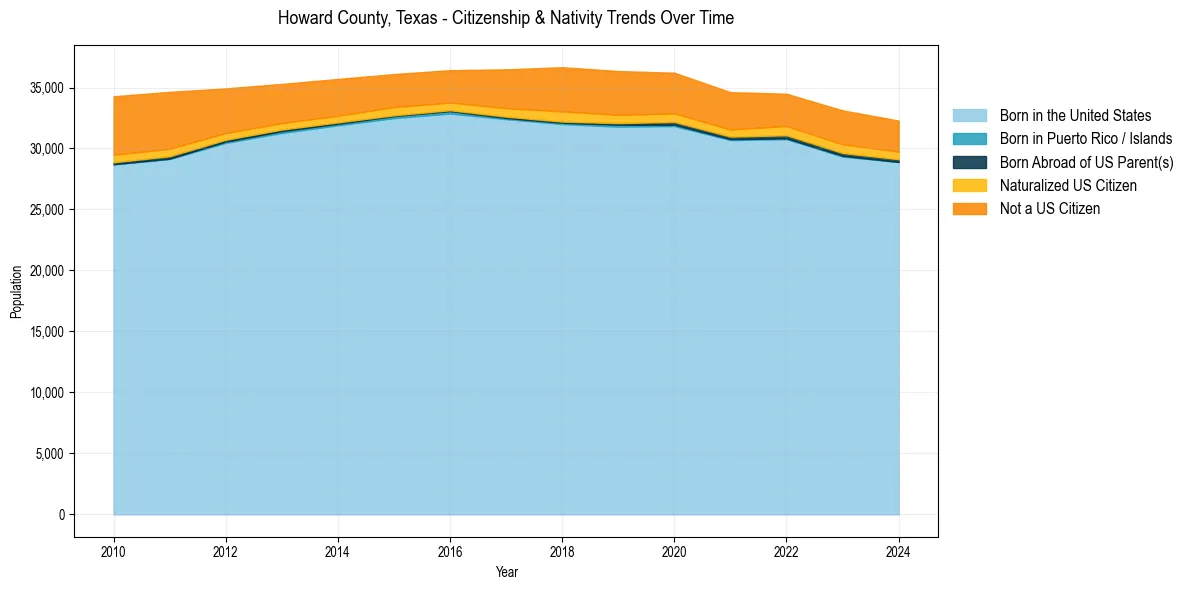
Howard County, Texas Population & Nativity History
| Year | Total Pop | Foreign Born | Native Born |
|---|---|---|---|
| 2024 | 32,290 | 9.8% | 90.2% |
| 2023 | 33,127 | 10.6% | 89.4% |
| 2022 | 34,488 | 9.9% | 90.1% |
| 2021 | 34,620 | 10.5% | 89.5% |
| 2020 | 36,213 | 11.1% | 88.9% |
| 2019 | 36,349 | 11.8% | 88.2% |
| 2018 | 36,667 | 12.2% | 87.8% |
| 2017 | 36,491 | 10.6% | 89.4% |
| 2016 | 36,423 | 9.0% | 91.0% |
| 2015 | 36,105 | 9.4% | 90.6% |
| 2014 | 35,702 | 10.0% | 90.0% |
| 2013 | 35,297 | 10.6% | 89.4% |
| 2012 | 34,927 | 12.1% | 87.9% |
| 2011 | 34,645 | 15.2% | 84.8% |
| 2010 | 34,285 | 15.8% | 84.2% |
Nativity & Citizenship FAQs for Howard County, Texas
Approximately 9.8% of residents in Howard County, Texas were born outside the United States.
The vast majority of residents, roughly 92.1%, are U.S. citizens (including both native-born and naturalized citizens).