Jim Wells County, Texas Nativity & Citizenship Status (2024)
Place of birth and citizenship status analysis for Jim Wells County, Texas
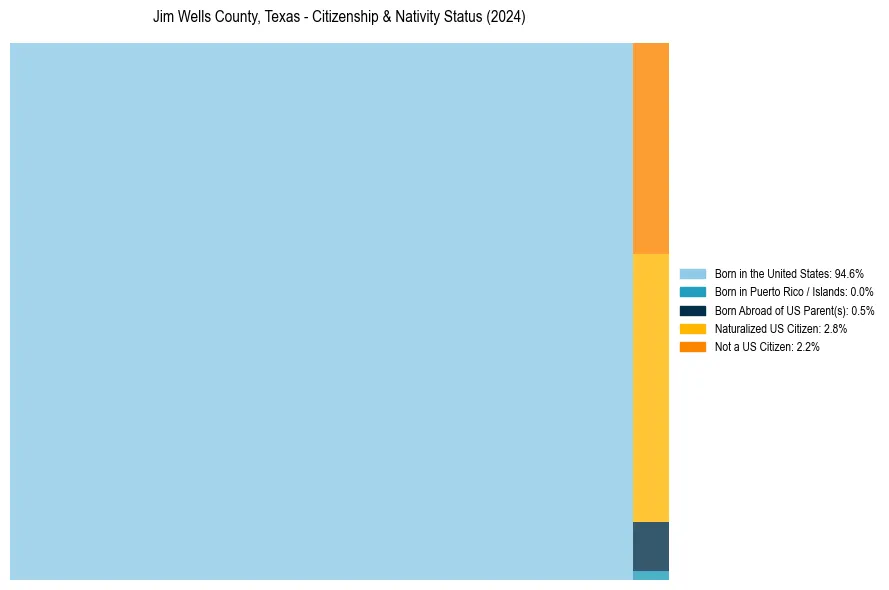
Jim Wells County, Texas Nativity & Citizenship Indicators (2024)
Native Born
95.1%
Foreign Born
4.9%
Naturalized
2.8%
US Citizens
97.8%
Jim Wells County, Texas Nativity & Citizenship Distribution
Jim Wells County, Texas Historical Nativity Trends (2010–2024)
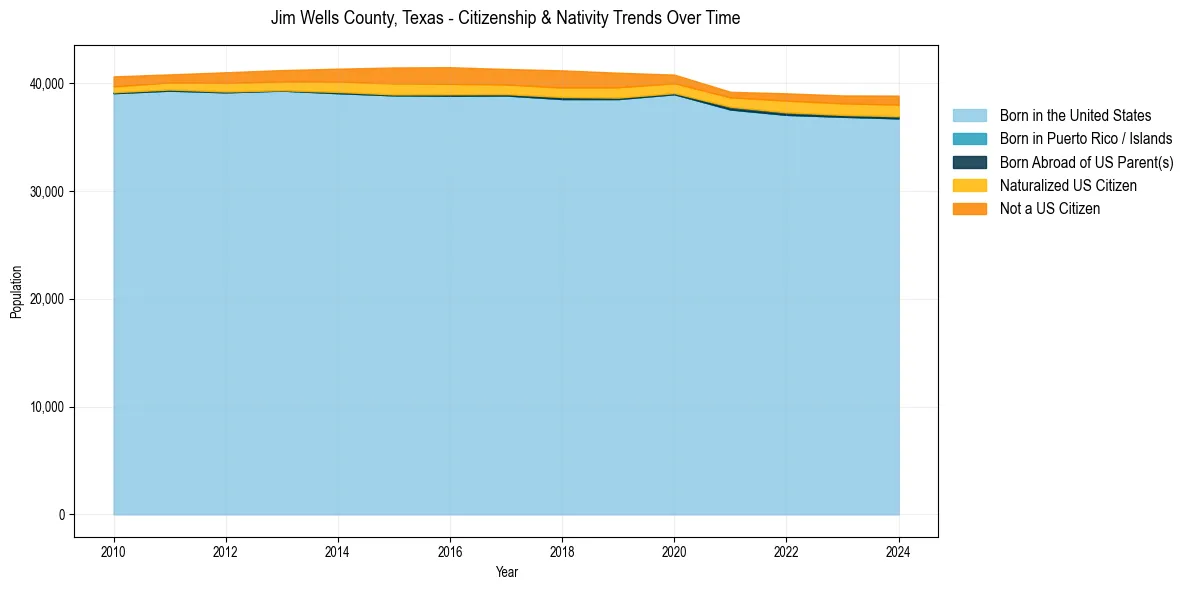
Jim Wells County, Texas Population & Nativity History
| Year | Total Pop | Foreign Born | Native Born |
|---|---|---|---|
| 2024 | 38,850 | 4.9% | 95.1% |
| 2023 | 38,863 | 4.6% | 95.4% |
| 2022 | 39,060 | 4.5% | 95.5% |
| 2021 | 39,203 | 3.5% | 96.5% |
| 2020 | 40,796 | 4.2% | 95.8% |
| 2019 | 40,972 | 5.6% | 94.4% |
| 2018 | 41,192 | 6.0% | 94.0% |
| 2017 | 41,318 | 5.6% | 94.4% |
| 2016 | 41,486 | 6.1% | 93.9% |
| 2015 | 41,461 | 6.0% | 94.0% |
| 2014 | 41,348 | 5.2% | 94.8% |
| 2013 | 41,217 | 4.5% | 95.5% |
| 2012 | 41,014 | 4.4% | 95.6% |
| 2011 | 40,821 | 3.4% | 96.6% |
| 2010 | 40,631 | 3.6% | 96.4% |
Nativity & Citizenship FAQs for Jim Wells County, Texas
Approximately 4.9% of residents in Jim Wells County, Texas were born outside the United States.
The vast majority of residents, roughly 97.8%, are U.S. citizens (including both native-born and naturalized citizens).