Limestone County, Texas Nativity & Citizenship Status (2024)
Place of birth and citizenship status analysis for Limestone County, Texas
Limestone County, Texas Nativity & Citizenship Indicators (2024)
Native Born
90.5%
Foreign Born
9.5%
Naturalized
2.5%
US Citizens
93.0%
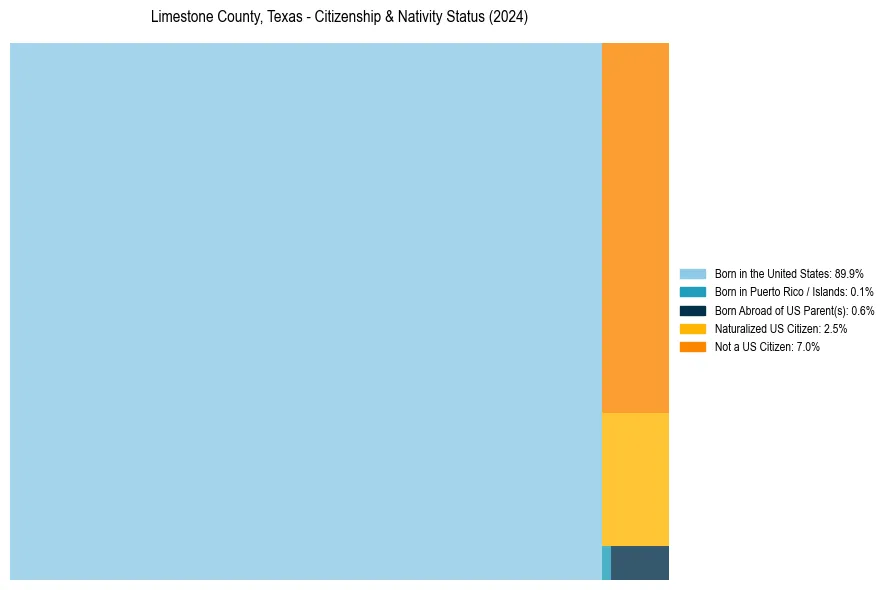
Limestone County, Texas Nativity & Citizenship Distribution
Limestone County, Texas Historical Nativity Trends (2010–2024)
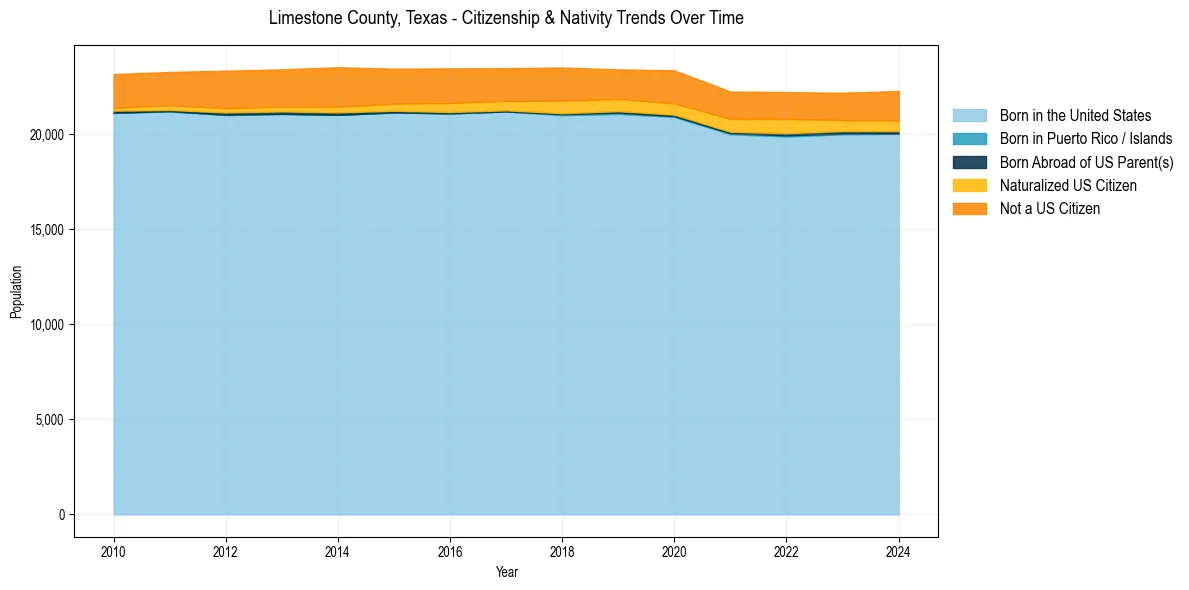
Limestone County, Texas Population & Nativity History
| Year | Total Pop | Foreign Born | Native Born |
|---|---|---|---|
| 2024 | 22,283 | 9.5% | 90.5% |
| 2023 | 22,185 | 9.1% | 90.9% |
| 2022 | 22,222 | 9.7% | 90.3% |
| 2021 | 22,252 | 9.5% | 90.5% |
| 2020 | 23,364 | 10.0% | 90.0% |
| 2019 | 23,417 | 9.4% | 90.6% |
| 2018 | 23,515 | 10.2% | 89.8% |
| 2017 | 23,480 | 9.5% | 90.5% |
| 2016 | 23,469 | 9.8% | 90.2% |
| 2015 | 23,454 | 9.4% | 90.6% |
| 2014 | 23,531 | 10.1% | 89.9% |
| 2013 | 23,417 | 9.5% | 90.5% |
| 2012 | 23,350 | 9.4% | 90.6% |
| 2011 | 23,282 | 8.6% | 91.4% |
| 2010 | 23,170 | 8.3% | 91.7% |
Nativity & Citizenship FAQs for Limestone County, Texas
Approximately 9.5% of residents in Limestone County, Texas were born outside the United States.
The vast majority of residents, roughly 93.0%, are U.S. citizens (including both native-born and naturalized citizens).