Maverick County, Texas Nativity & Citizenship Status (2024)
Place of birth and citizenship status analysis for Maverick County, Texas
Maverick County, Texas Nativity & Citizenship Indicators (2024)
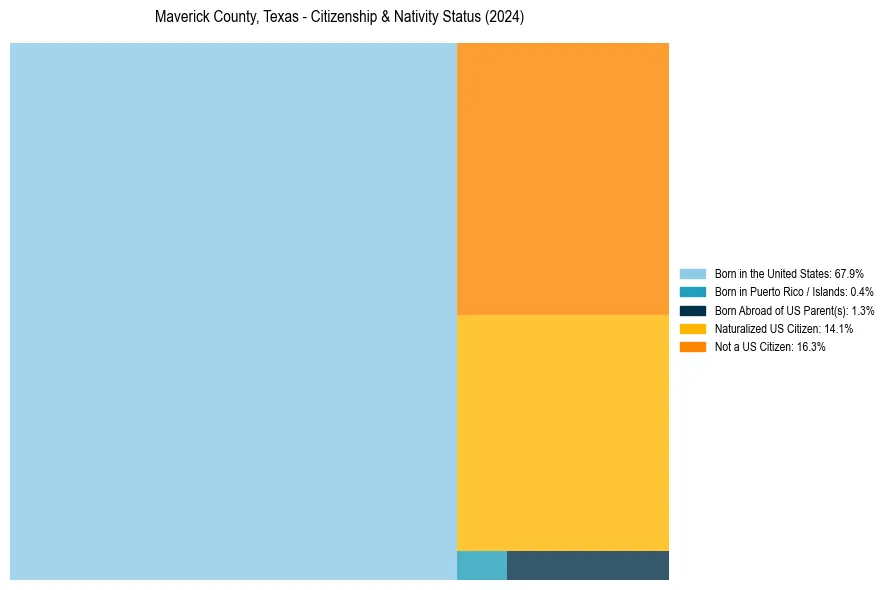
Native Born
69.6%
Foreign Born
30.4%
Naturalized
14.1%
US Citizens
83.7%
Maverick County, Texas Nativity & Citizenship Distribution
Maverick County, Texas Historical Nativity Trends (2010–2024)
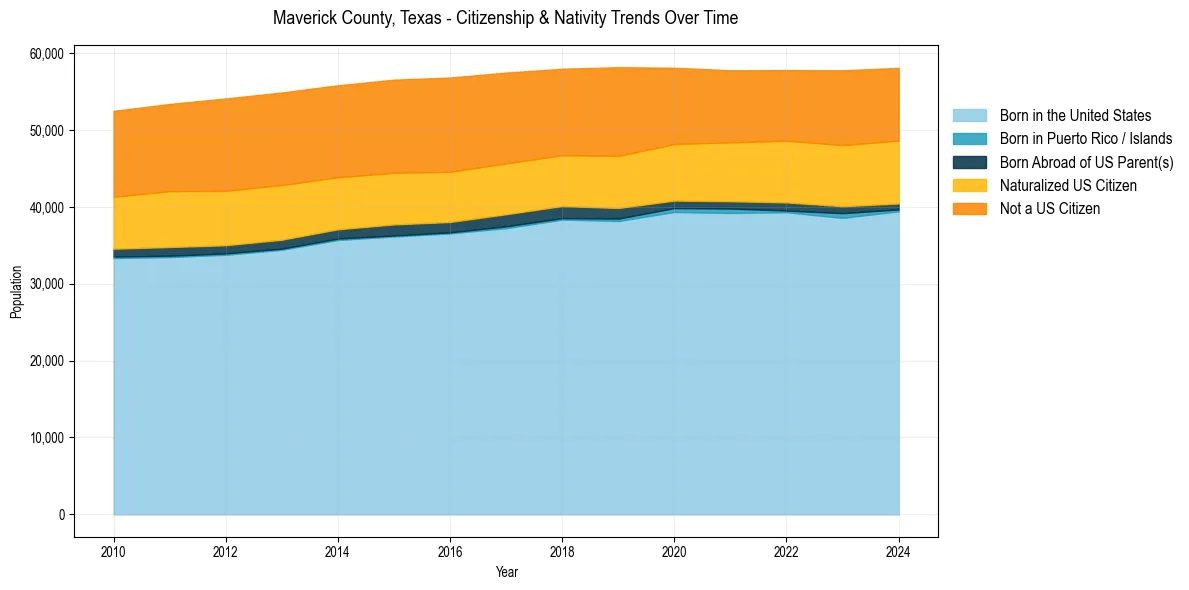
Maverick County, Texas Population & Nativity History
| Year | Total Pop | Foreign Born | Native Born |
|---|---|---|---|
| 2024 | 58,082 | 30.4% | 69.6% |
| 2023 | 57,770 | 30.6% | 69.4% |
| 2022 | 57,806 | 29.8% | 70.2% |
| 2021 | 57,769 | 29.5% | 70.5% |
| 2020 | 58,098 | 29.7% | 70.3% |
| 2019 | 58,174 | 31.5% | 68.5% |
| 2018 | 57,970 | 30.8% | 69.2% |
| 2017 | 57,471 | 32.1% | 67.9% |
| 2016 | 56,830 | 33.1% | 66.9% |
| 2015 | 56,548 | 33.3% | 66.7% |
| 2014 | 55,821 | 33.6% | 66.4% |
| 2013 | 54,880 | 34.9% | 65.1% |
| 2012 | 54,107 | 35.3% | 64.7% |
| 2011 | 53,389 | 34.9% | 65.1% |
| 2010 | 52,493 | 34.2% | 65.8% |
Nativity & Citizenship FAQs for Maverick County, Texas
Approximately 30.4% of residents in Maverick County, Texas were born outside the United States.
The vast majority of residents, roughly 83.7%, are U.S. citizens (including both native-born and naturalized citizens).