Moore County, Texas Nativity & Citizenship Status (2024)
Place of birth and citizenship status analysis for Moore County, Texas
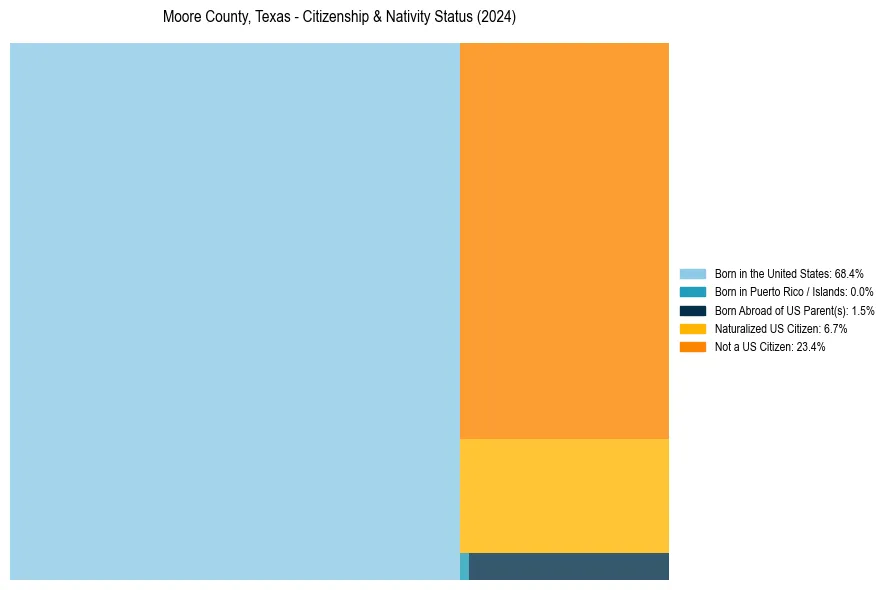
Moore County, Texas Nativity & Citizenship Indicators (2024)
Native Born
69.9%
Foreign Born
30.1%
Naturalized
6.7%
US Citizens
76.6%
Moore County, Texas Nativity & Citizenship Distribution
Moore County, Texas Historical Nativity Trends (2010–2024)
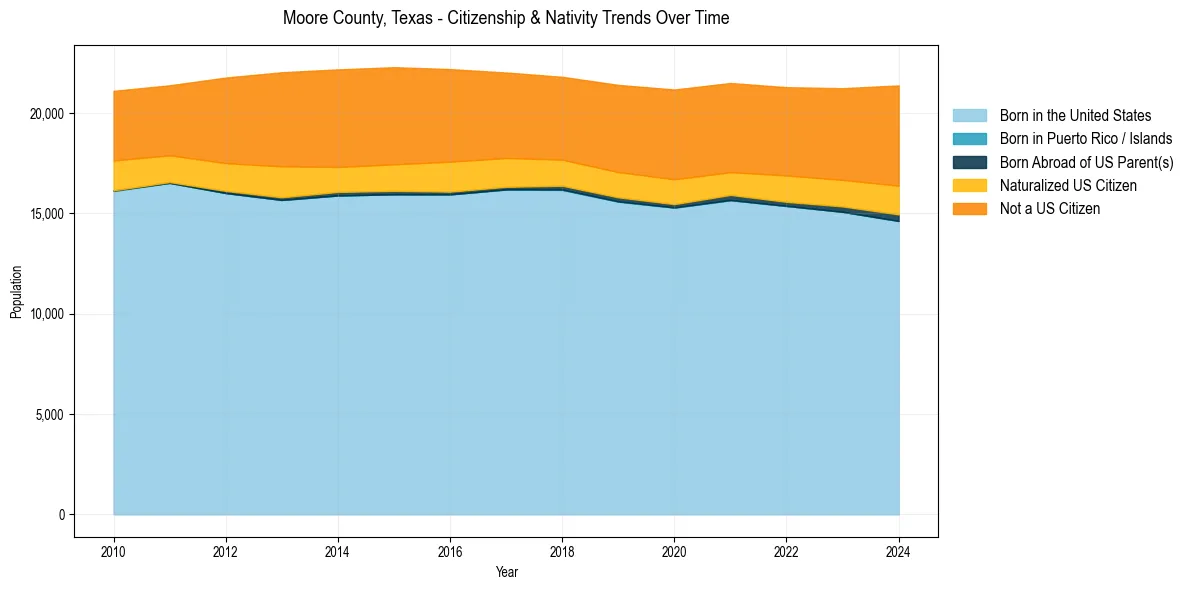
Moore County, Texas Population & Nativity History
| Year | Total Pop | Foreign Born | Native Born |
|---|---|---|---|
| 2024 | 21,373 | 30.1% | 69.9% |
| 2023 | 21,234 | 27.7% | 72.3% |
| 2022 | 21,284 | 26.8% | 73.2% |
| 2021 | 21,494 | 26.0% | 74.0% |
| 2020 | 21,169 | 27.0% | 73.0% |
| 2019 | 21,399 | 26.2% | 73.8% |
| 2018 | 21,801 | 24.9% | 75.1% |
| 2017 | 22,016 | 25.9% | 74.1% |
| 2016 | 22,186 | 27.5% | 72.5% |
| 2015 | 22,281 | 27.7% | 72.3% |
| 2014 | 22,172 | 27.5% | 72.5% |
| 2013 | 22,029 | 28.3% | 71.7% |
| 2012 | 21,765 | 26.0% | 74.0% |
| 2011 | 21,379 | 22.6% | 77.4% |
| 2010 | 21,102 | 23.5% | 76.5% |
Nativity & Citizenship FAQs for Moore County, Texas
Approximately 30.1% of residents in Moore County, Texas were born outside the United States.
The vast majority of residents, roughly 76.6%, are U.S. citizens (including both native-born and naturalized citizens).