Navarro County, Texas Nativity & Citizenship Status (2024)
Place of birth and citizenship status analysis for Navarro County, Texas
Navarro County, Texas Nativity & Citizenship Indicators (2024)
Native Born
87.1%
Foreign Born
12.9%
Naturalized
4.6%
US Citizens
91.7%
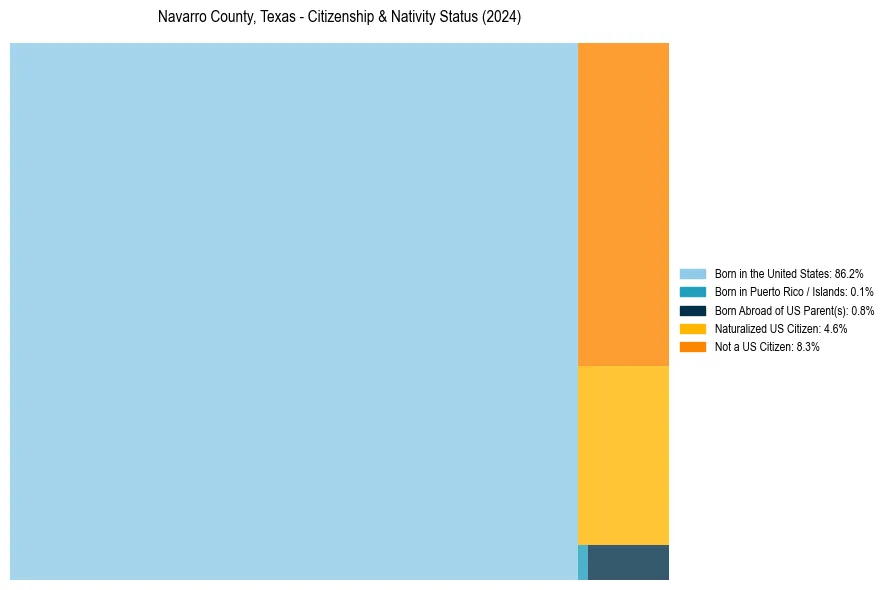
Navarro County, Texas Nativity & Citizenship Distribution
Navarro County, Texas Historical Nativity Trends (2010–2024)
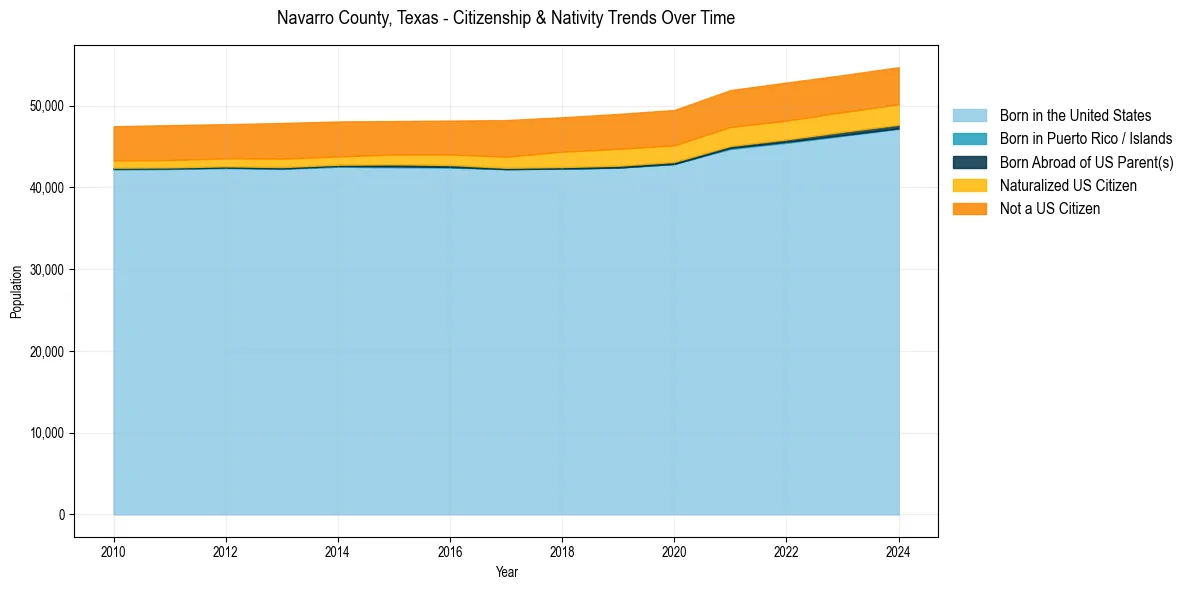
Navarro County, Texas Population & Nativity History
| Year | Total Pop | Foreign Born | Native Born |
|---|---|---|---|
| 2024 | 54,711 | 12.9% | 87.1% |
| 2023 | 53,735 | 12.9% | 87.1% |
| 2022 | 52,834 | 13.2% | 86.8% |
| 2021 | 51,908 | 13.2% | 86.8% |
| 2020 | 49,475 | 12.8% | 87.2% |
| 2019 | 48,995 | 12.9% | 87.1% |
| 2018 | 48,583 | 12.5% | 87.5% |
| 2017 | 48,239 | 12.1% | 87.9% |
| 2016 | 48,177 | 11.3% | 88.7% |
| 2015 | 48,118 | 11.0% | 89.0% |
| 2014 | 48,073 | 11.0% | 89.0% |
| 2013 | 47,883 | 11.3% | 88.7% |
| 2012 | 47,739 | 10.8% | 89.2% |
| 2011 | 47,621 | 10.9% | 89.1% |
| 2010 | 47,483 | 10.7% | 89.3% |
Nativity & Citizenship FAQs for Navarro County, Texas
Approximately 12.9% of residents in Navarro County, Texas were born outside the United States.
The vast majority of residents, roughly 91.7%, are U.S. citizens (including both native-born and naturalized citizens).