Ochiltree County, Texas Nativity & Citizenship Status (2024)
Place of birth and citizenship status analysis for Ochiltree County, Texas
Ochiltree County, Texas Nativity & Citizenship Indicators (2024)
Native Born
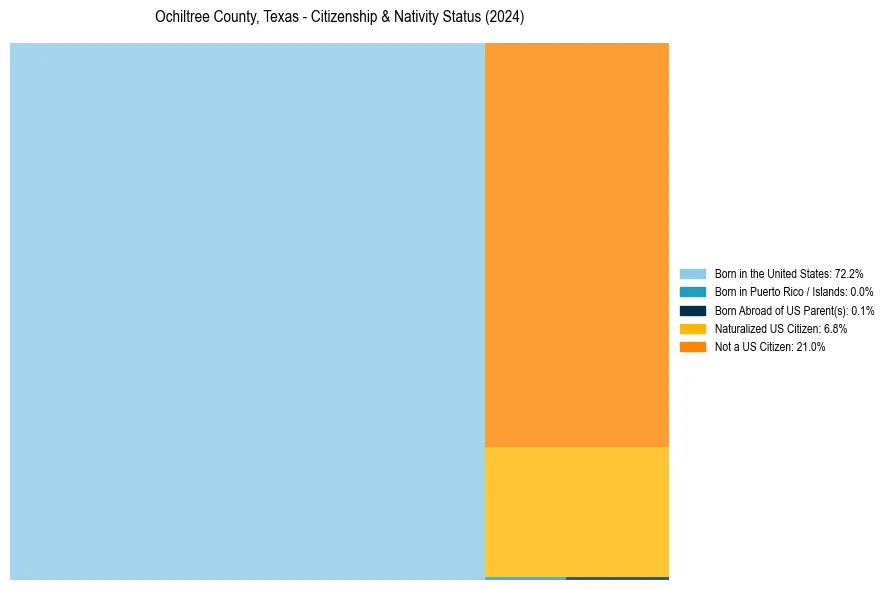
72.3%
Foreign Born
27.7%
Naturalized
6.8%
US Citizens
79.0%
Ochiltree County, Texas Nativity & Citizenship Distribution
Ochiltree County, Texas Historical Nativity Trends (2010–2024)
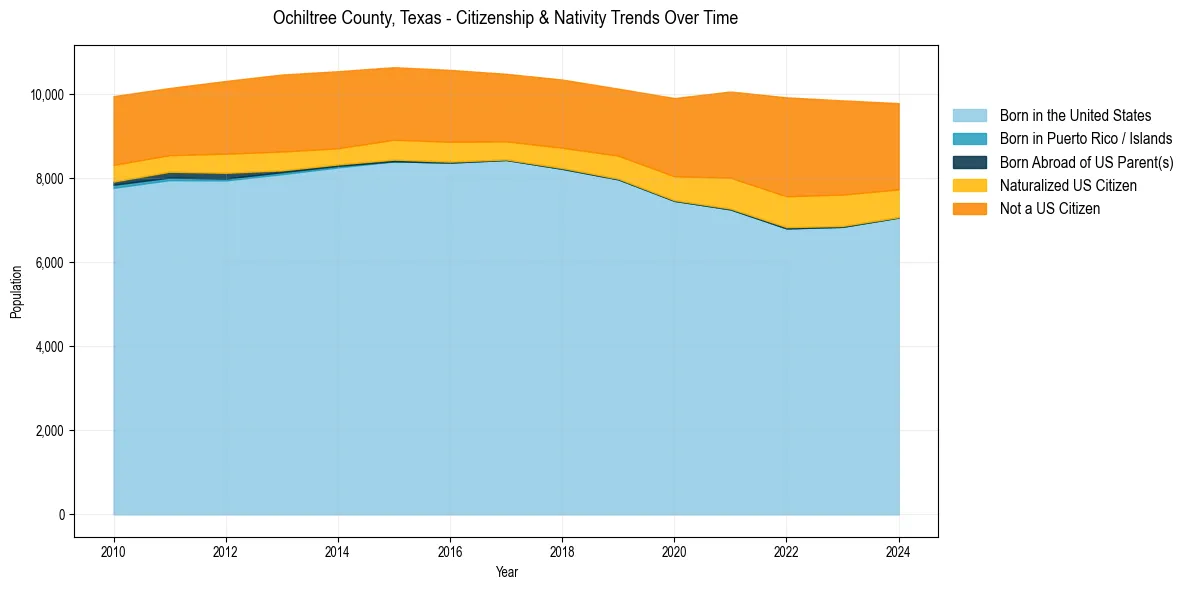
Ochiltree County, Texas Population & Nativity History
| Year | Total Pop | Foreign Born | Native Born |
|---|---|---|---|
| 2024 | 9,786 | 27.7% | 72.3% |
| 2023 | 9,852 | 30.3% | 69.7% |
| 2022 | 9,924 | 31.1% | 68.9% |
| 2021 | 10,063 | 27.7% | 72.3% |
| 2020 | 9,907 | 24.5% | 75.5% |
| 2019 | 10,131 | 21.1% | 78.9% |
| 2018 | 10,348 | 20.4% | 79.6% |
| 2017 | 10,484 | 19.4% | 80.6% |
| 2016 | 10,577 | 20.6% | 79.4% |
| 2015 | 10,642 | 20.7% | 79.3% |
| 2014 | 10,546 | 21.0% | 79.0% |
| 2013 | 10,467 | 21.8% | 78.2% |
| 2012 | 10,314 | 21.2% | 78.8% |
| 2011 | 10,147 | 19.6% | 80.4% |
| 2010 | 9,953 | 20.4% | 79.6% |
Nativity & Citizenship FAQs for Ochiltree County, Texas
Approximately 27.7% of residents in Ochiltree County, Texas were born outside the United States.
The vast majority of residents, roughly 79.0%, are U.S. citizens (including both native-born and naturalized citizens).