Polk County, Texas Nativity & Citizenship Status (2024)
Place of birth and citizenship status analysis for Polk County, Texas
Polk County, Texas Nativity & Citizenship Indicators (2024)
Native Born
95.5%
Foreign Born
4.5%
Naturalized
2.1%
US Citizens
97.6%
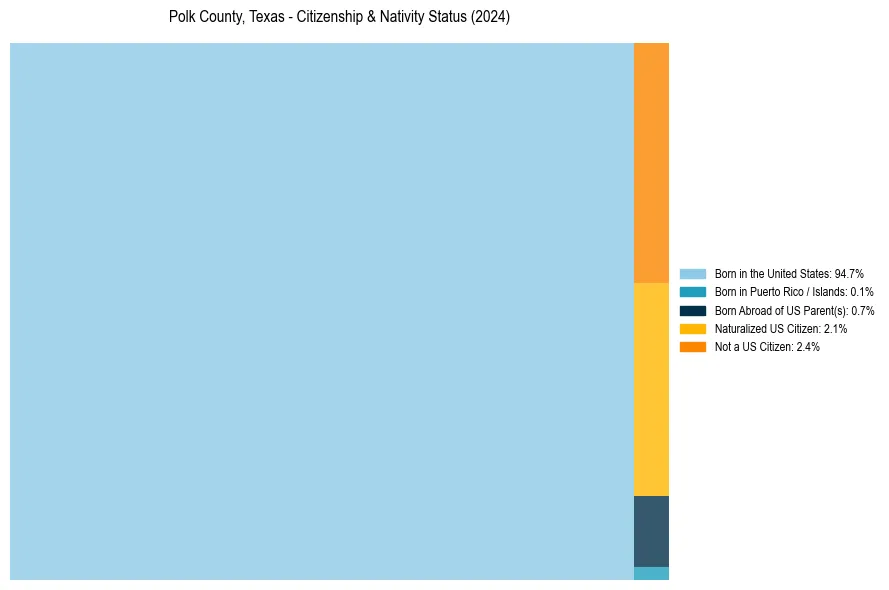
Polk County, Texas Nativity & Citizenship Distribution
Polk County, Texas Historical Nativity Trends (2010–2024)
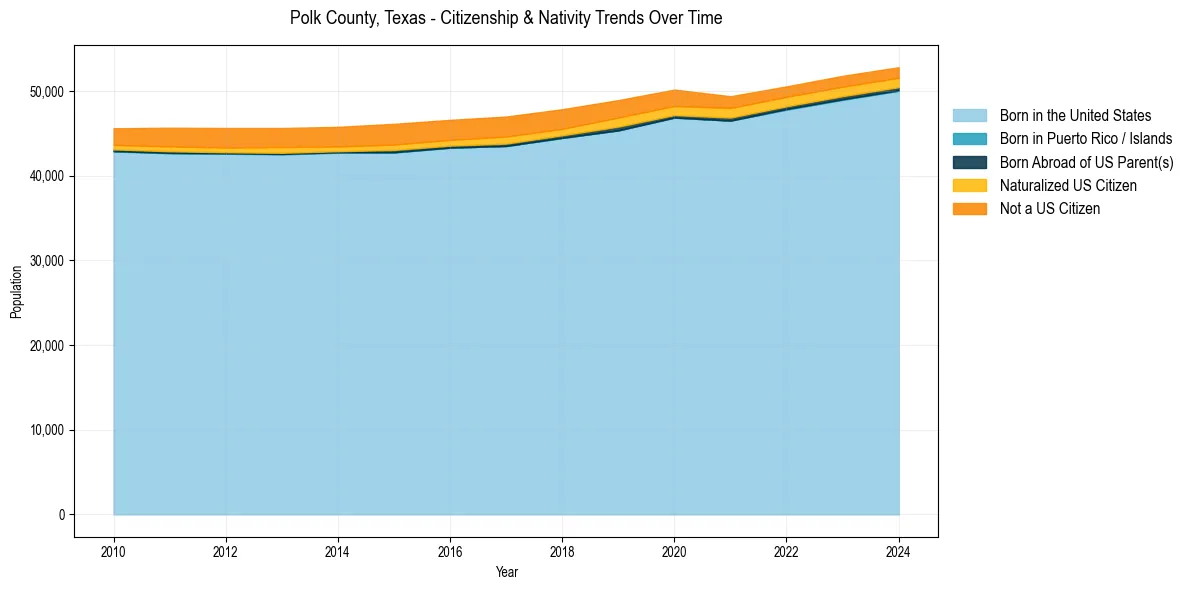
Polk County, Texas Population & Nativity History
| Year | Total Pop | Foreign Born | Native Born |
|---|---|---|---|
| 2024 | 52,800 | 4.5% | 95.5% |
| 2023 | 51,780 | 4.6% | 95.4% |
| 2022 | 50,536 | 4.7% | 95.3% |
| 2021 | 49,372 | 5.1% | 94.9% |
| 2020 | 50,155 | 6.0% | 94.0% |
| 2019 | 48,913 | 6.4% | 93.6% |
| 2018 | 47,837 | 6.4% | 93.6% |
| 2017 | 46,974 | 6.8% | 93.2% |
| 2016 | 46,583 | 6.5% | 93.5% |
| 2015 | 46,113 | 6.7% | 93.3% |
| 2014 | 45,757 | 6.3% | 93.7% |
| 2013 | 45,620 | 6.4% | 93.6% |
| 2012 | 45,618 | 6.3% | 93.7% |
| 2011 | 45,653 | 6.1% | 93.9% |
| 2010 | 45,590 | 5.5% | 94.5% |
Nativity & Citizenship FAQs for Polk County, Texas
Approximately 4.5% of residents in Polk County, Texas were born outside the United States.
The vast majority of residents, roughly 97.6%, are U.S. citizens (including both native-born and naturalized citizens).