Roberts County, Texas Age & Gender Distribution (2024)
Population distribution by age and gender for Roberts County, Texas
Roberts County, Texas Age & Gender Statistics (2024)
Total Population
832
Median Age
40.0
Male Median
40.3
Female Median
37.6
Roberts County, Texas Population Growth
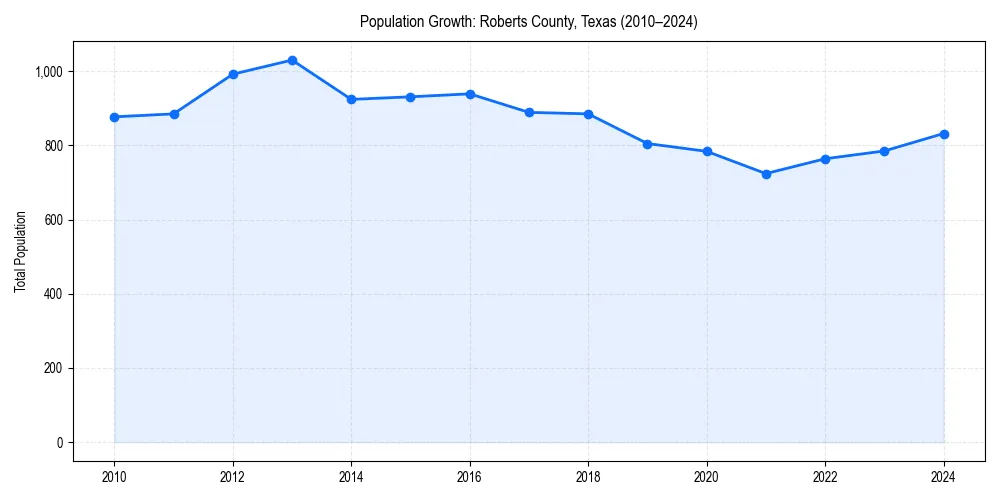
Roberts County, Texas Demographic Trend
Since 2010, the population of has changed by -5.1%%.
-5.1%% Growth
Roberts County, Texas Age & Gender Pyramid
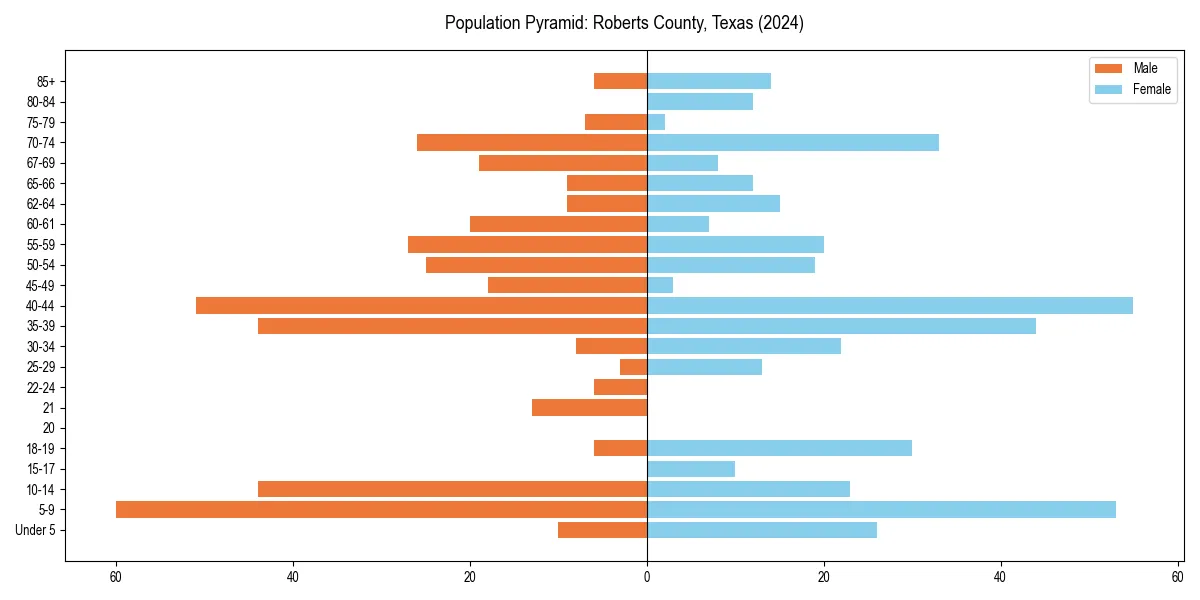
Figure 2: Population distribution by age and gender for 2024.
Roberts County, Texas Historical Population Data
| Year | Median Age | Population |
|---|---|---|
| 2024 | 40.0 | 832 |
| 2023 | 39.4 | 785 |
| 2022 | 42.5 | 764 |
| 2021 | 50.3 | 724 |
| 2020 | 47.2 | 784 |
| 2019 | 43.2 | 805 |
| 2018 | 38.0 | 885 |
| 2017 | 37.8 | 889 |
| 2016 | 35.6 | 939 |
| 2015 | 37.6 | 931 |
| 2014 | 44.8 | 924 |
| 2013 | 44.8 | 1,030 |
| 2012 | 41.9 | 992 |
| 2011 | 44.7 | 885 |
| 2010 | 45.1 | 877 |
Roberts County, Texas Age Group Breakdown (2024)
| Age Cohort | Percentage |
|---|---|
| Under 5 | 4.3% |
| 5–17 | 22.8% |
| 18–24 | 6.6% |
| 25–34 | 5.5% |
| 35–54 | 31.1% |
| 55–64 | 11.8% |
| 65+ | 17.8% |
Dependency Ratios for Roberts County, Texas
- Total Dependency Ratio:
- 81.7
- Youth Dependency:
- 49.3
- Old-Age Dependency:
- 32.3
The dependency ratio measures dependents (ages 0-17 and 65+) per 100 working-age individuals (ages 18-64).
Age & Gender FAQs for Roberts County, Texas
The median age in Roberts County, Texas is 40.0 years.
According to latest Census data, the total population of Roberts County, Texas is 832.
In Roberts County, Texas, seniors (ages 65+) make up 17.8% of the population, while children under 18 represent 22.8%.
Based on historical data since 2010, the population in Roberts County, Texas is becoming younger.