Roberts County, Texas Employment Sector Statistics (2024)
Workforce distribution by employment sector for Roberts County, Texas
Employment Indicators for Roberts County, Texas (2024)
Total Employed
388
Civilian 16+
Private For-Profit
67.8 %
Largest Sector
Self-Employed
9.0%
Entrepreneurship
Government
22.4%
Public Sector
Roberts County, Texas Workforce by Sector & Gender
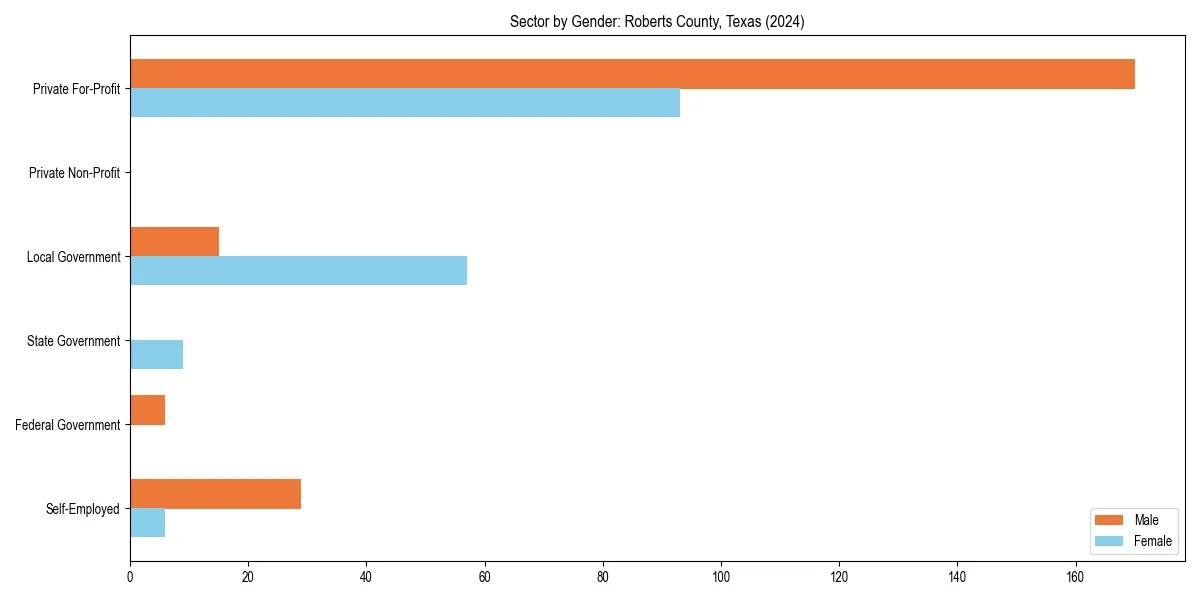
Roberts County, Texas Employment Sector Breakdown
| Sector | Total Workers | Percentage |
|---|---|---|
| Private For-Profit | 263 | 67.8% |
| Government | 87 | 22.4% |
| Self-Employed | 35 | 9.0% |
| Private Non-Profit | 0 | 0.0% |
Roberts County, Texas Gender Ratio Analysis by Employment Sector (2024)
| Sector | Male:Female Ratio |
|---|---|
| Private For-Profit | 1.83:1 |
| Government | 0.32:1 |
| Self-Employed | 4.83:1 |
Roberts County, Texas Employment Trends (2010–2024)
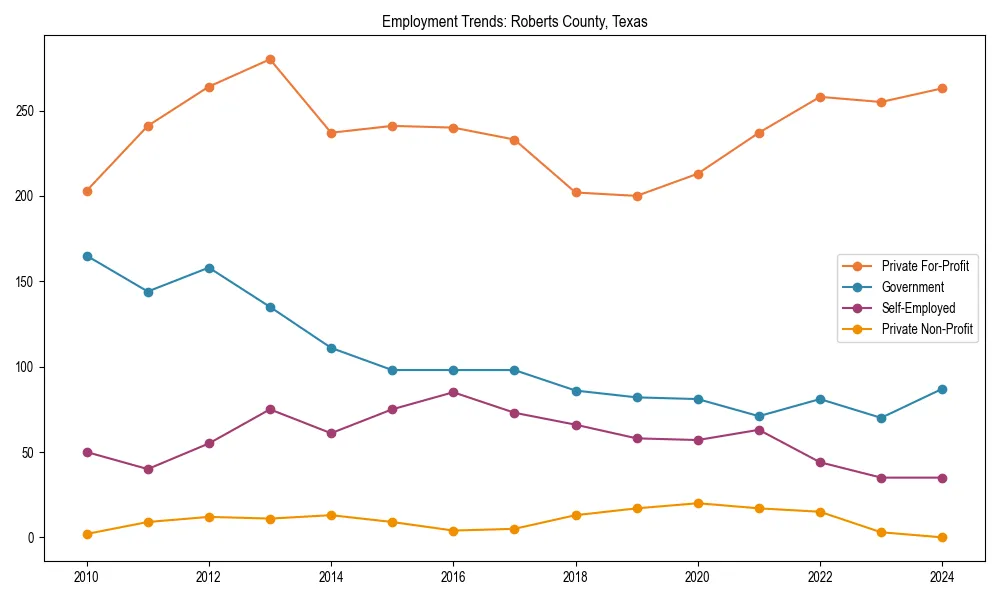
Roberts County, Texas Historical Employment Sector Trends
| Year | Private | Gov | Self-Emp | Non-Profit |
|---|---|---|---|---|
| 2024 | 67.8% | 22.4% | 9.0% | 0.0% |
| 2023 | 69.9% | 19.2% | 9.6% | 0.8% |
| 2022 | 64.8% | 20.4% | 11.1% | 3.8% |
| 2021 | 61.1% | 18.3% | 16.2% | 4.4% |
| 2020 | 57.4% | 21.8% | 15.4% | 5.4% |
| 2019 | 56.0% | 23.0% | 16.2% | 4.8% |
| 2018 | 55.0% | 23.4% | 18.0% | 3.5% |
| 2017 | 57.0% | 24.0% | 17.8% | 1.2% |
| 2016 | 56.2% | 23.0% | 19.9% | 0.9% |
| 2015 | 57.0% | 23.2% | 17.7% | 2.1% |
| 2014 | 56.2% | 26.3% | 14.5% | 3.1% |
| 2013 | 55.9% | 26.9% | 15.0% | 2.2% |
| 2012 | 53.5% | 32.0% | 11.2% | 2.4% |
| 2011 | 55.1% | 33.0% | 9.2% | 2.1% |
| 2010 | 47.9% | 38.9% | 11.8% | 0.5% |
Employment Sector FAQs for Roberts County, Texas
The largest employment sector in Roberts County, Texas is Private For-Profit, which employs 67.8% of the local workforce.
There are approximately 388 civilian workers aged 16 and over currently employed in Roberts County, Texas.
In the private for-profit sector, the male-to-female ratio is 1.83:1. This metric helps highlight gender participation across the most prominent industry classes.
Since 2010, the total number of workers in Roberts County, Texas has shown a decrease, moving from 424 to 388 according to Census Bureau records.