Roberts County, Texas Nativity & Citizenship Status (2024)
Place of birth and citizenship status analysis for Roberts County, Texas
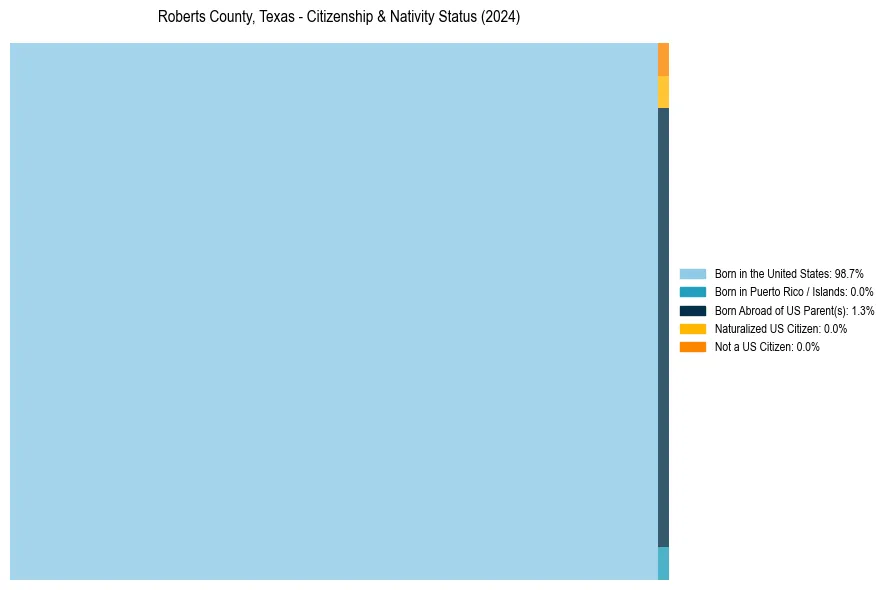
Roberts County, Texas Nativity & Citizenship Indicators (2024)
Native Born
100.0%
Foreign Born
0.0%
Naturalized
0.0%
US Citizens
100.0%
Roberts County, Texas Nativity & Citizenship Distribution
Roberts County, Texas Historical Nativity Trends (2010–2024)
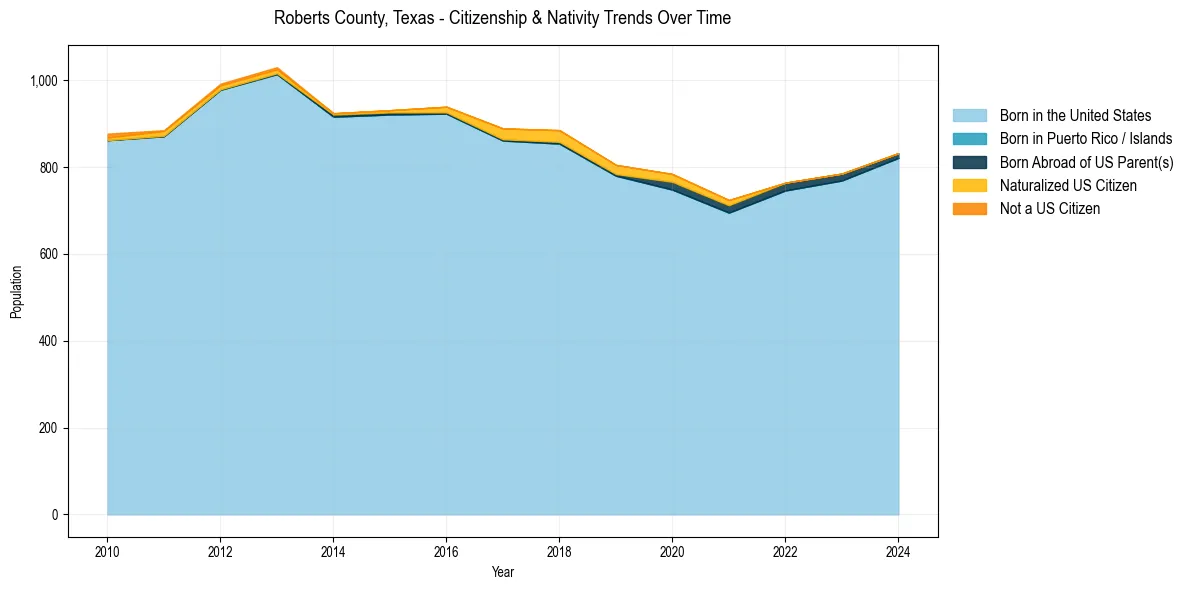
Roberts County, Texas Population & Nativity History
| Year | Total Pop | Foreign Born | Native Born |
|---|---|---|---|
| 2024 | 832 | 0.0% | 100.0% |
| 2023 | 785 | 0.0% | 100.0% |
| 2022 | 764 | 0.0% | 100.0% |
| 2021 | 724 | 1.7% | 98.3% |
| 2020 | 784 | 2.3% | 97.7% |
| 2019 | 805 | 2.6% | 97.4% |
| 2018 | 885 | 3.1% | 96.9% |
| 2017 | 889 | 2.8% | 97.2% |
| 2016 | 939 | 1.4% | 98.6% |
| 2015 | 931 | 0.5% | 99.5% |
| 2014 | 924 | 0.3% | 99.7% |
| 2013 | 1,030 | 1.4% | 98.6% |
| 2012 | 992 | 1.3% | 98.7% |
| 2011 | 885 | 1.5% | 98.5% |
| 2010 | 877 | 1.7% | 98.3% |
Nativity & Citizenship FAQs for Roberts County, Texas
Approximately 0.0% of residents in Roberts County, Texas were born outside the United States.
The vast majority of residents, roughly 100.0%, are U.S. citizens (including both native-born and naturalized citizens).