Roberts County, Texas Commute & Transportation Patterns (2024)
Means of transportation and remote work analysis for Roberts County, Texas
Roberts County, Texas Transportation Indicators (2024)
Total Workers
388
Population 16+
driving
86.9%
Most Common Choice
Work From Home
1.8%
Remote Share
Public Transit
0.0%
Bus/Rail/Ferry
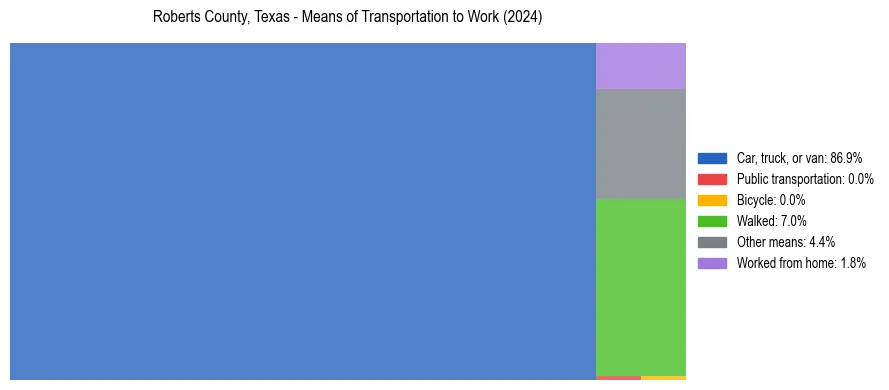
Roberts County, Texas Commute Mode Distribution
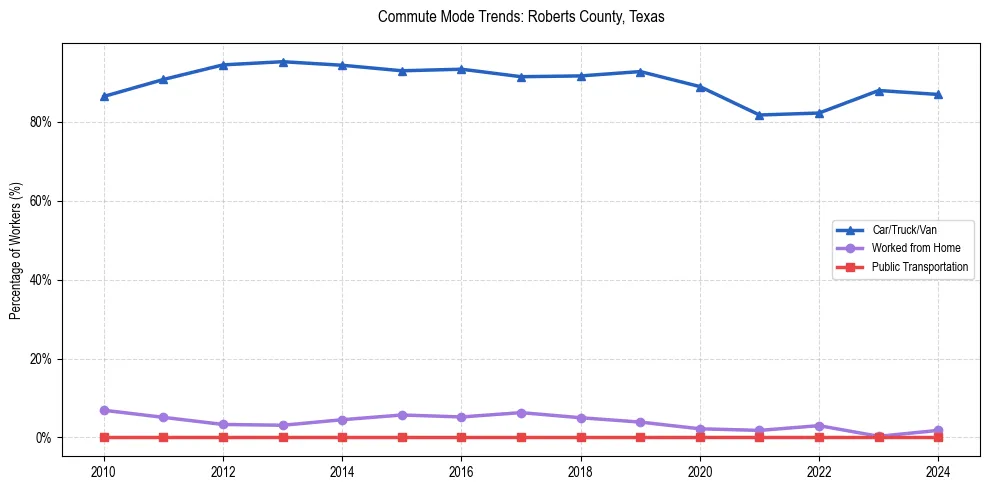
Roberts County, Texas Historical Commuting Trends
Roberts County, Texas Detailed Commute Breakdown
| Mode | Workers | Percentage |
|---|---|---|
| Car, truck, or van | 337 | 86.9% |
| Public transportation | 0 | 0.0% |
| Bicycle | 0 | 0.0% |
| Walked | 27 | 7.0% |
| Other means | 17 | 4.4% |
| Worked from home | 7 | 1.8% |
Commuting Patterns FAQs for Roberts County, Texas
The most common way is driving a car, truck, or van, with 86.9% of workers in Roberts County, Texas utilizing this as their primary means of transportation to work.
Since 2010, the percentage of residents working from home in Roberts County, Texas has decreased. Currently, 1.8% of the workforce works remotely, which is lower than the U.S. national average of 15.1%.
Approximately 1.8% of workers in Roberts County, Texas currently work remotely, compared to the national average of 15.1%.