Val Verde County, Texas Nativity & Citizenship Status (2024)
Place of birth and citizenship status analysis for Val Verde County, Texas
Val Verde County, Texas Nativity & Citizenship Indicators (2024)
Native Born
80.1%
Foreign Born
19.9%
Naturalized
10.1%
US Citizens
90.2%
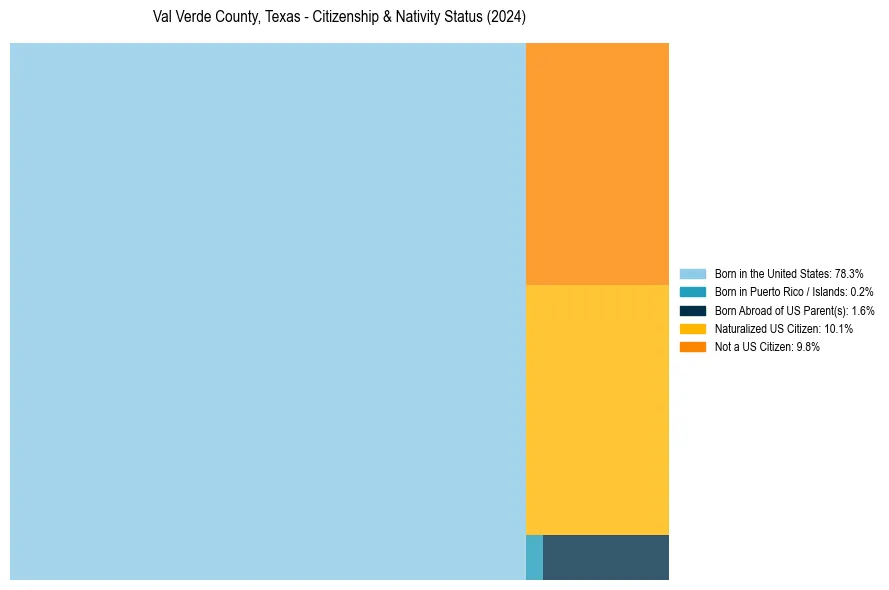
Val Verde County, Texas Nativity & Citizenship Distribution
Val Verde County, Texas Historical Nativity Trends (2010–2024)
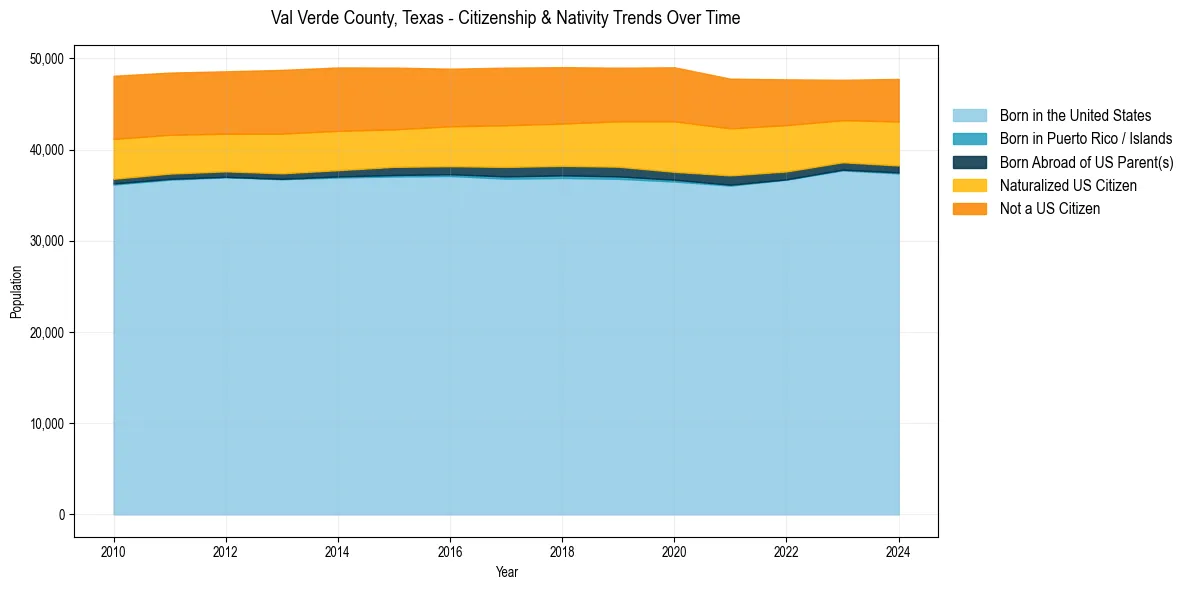
Val Verde County, Texas Population & Nativity History
| Year | Total Pop | Foreign Born | Native Born |
|---|---|---|---|
| 2024 | 47,741 | 19.9% | 80.1% |
| 2023 | 47,647 | 19.0% | 81.0% |
| 2022 | 47,693 | 21.2% | 78.8% |
| 2021 | 47,767 | 22.2% | 77.8% |
| 2020 | 49,018 | 23.4% | 76.6% |
| 2019 | 48,969 | 22.2% | 77.8% |
| 2018 | 49,027 | 22.1% | 77.9% |
| 2017 | 48,976 | 22.2% | 77.8% |
| 2016 | 48,862 | 21.9% | 78.1% |
| 2015 | 48,980 | 22.2% | 77.8% |
| 2014 | 48,999 | 23.0% | 77.0% |
| 2013 | 48,730 | 23.3% | 76.7% |
| 2012 | 48,578 | 22.6% | 77.4% |
| 2011 | 48,434 | 22.9% | 77.1% |
| 2010 | 48,088 | 23.5% | 76.5% |
Nativity & Citizenship FAQs for Val Verde County, Texas
Approximately 19.9% of residents in Val Verde County, Texas were born outside the United States.
The vast majority of residents, roughly 90.2%, are U.S. citizens (including both native-born and naturalized citizens).