Yoakum County, Texas Health Insurance Coverage (2024)
Detailed analysis of uninsured rates and coverage trends for Yoakum County, Texas
Universe
7,497
Total Uninsured
1,689
Uninsured Rate
22.5%
Coverage by Age and Gender
Distribution of insured vs. uninsured residents in Yoakum County, Texas
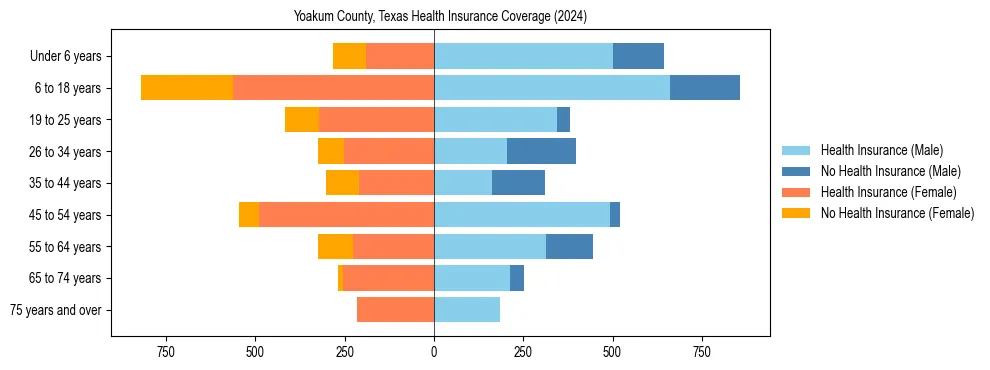
Uninsured Rates by Demographic Group
Under 18 Years
Male Uninsured22.5%
Female Uninsured31.8%
18 to 34 Years
Male Uninsured29.7%
Female Uninsured22.6%
35 to 64 Years
Male Uninsured24.0%
Female Uninsured20.7%
65 Years & Over
Male Uninsured8.7%
Female Uninsured2.7%
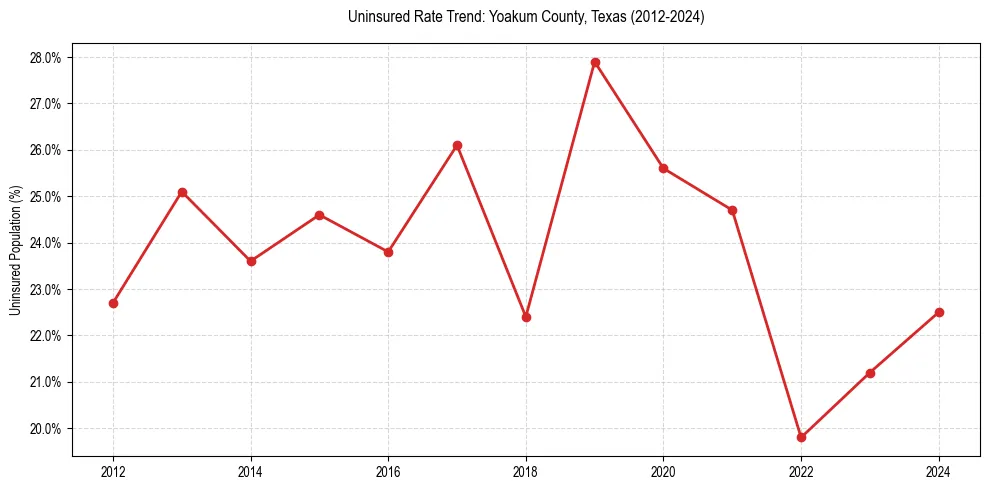
Uninsured Rate Trends
Historical coverage data from 2012 to 2024
| Year | Total Uninsured | Uninsured Rate |
|---|---|---|
| 2024 | 1,689 | 22.5% |
| 2023 | 1,600 | 21.2% |
| 2022 | 1,507 | 19.8% |
| 2021 | 1,903 | 24.7% |
| 2020 | 2,202 | 25.6% |
| 2019 | 2,406 | 27.9% |
| 2018 | 1,922 | 22.4% |
| 2017 | 2,211 | 26.1% |
| 2016 | 1,982 | 23.8% |
| 2015 | 2,014 | 24.6% |
| 2014 | 1,896 | 23.6% |
| 2013 | 2,001 | 25.1% |
| 2012 | 1,789 | 22.7% |
Frequently Asked Questions
Approximately 22.5% of the population in Yoakum County, Texas does not have health insurance coverage.
In Yoakum County, Texas, females under 18 face the highest barrier to coverage, with an uninsured rate of 31.8%. This is notably higher than the overall local average of 22.5%.