Utah Age & Gender Distribution (2024)
Population distribution by age and gender for Utah
Utah Age & Gender Statistics (2024)
Total Population
3,392,331
Median Age
32.0
Male Median
31.5
Female Median
32.5
Utah Population Growth
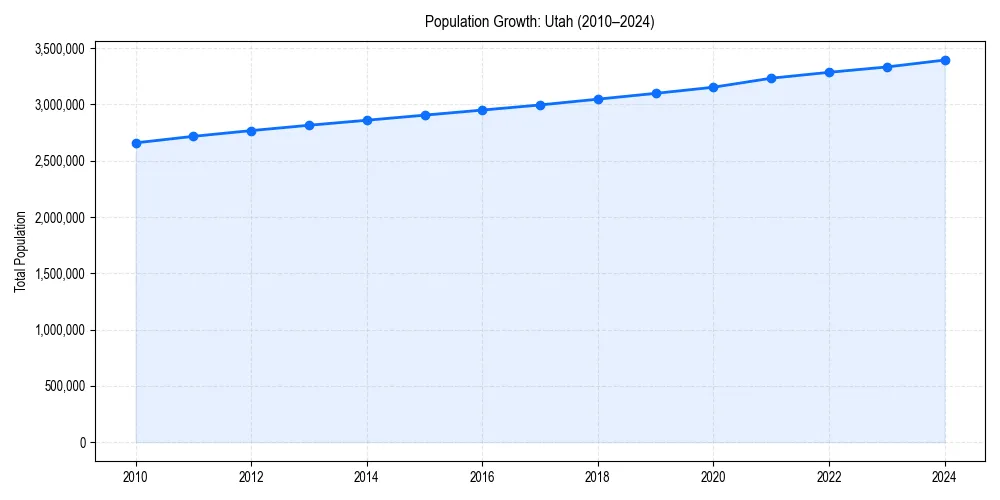
Utah Demographic Trend
Since 2010, the population of has changed by +27.7%%.
+27.7%% Growth
Utah Age & Gender Pyramid
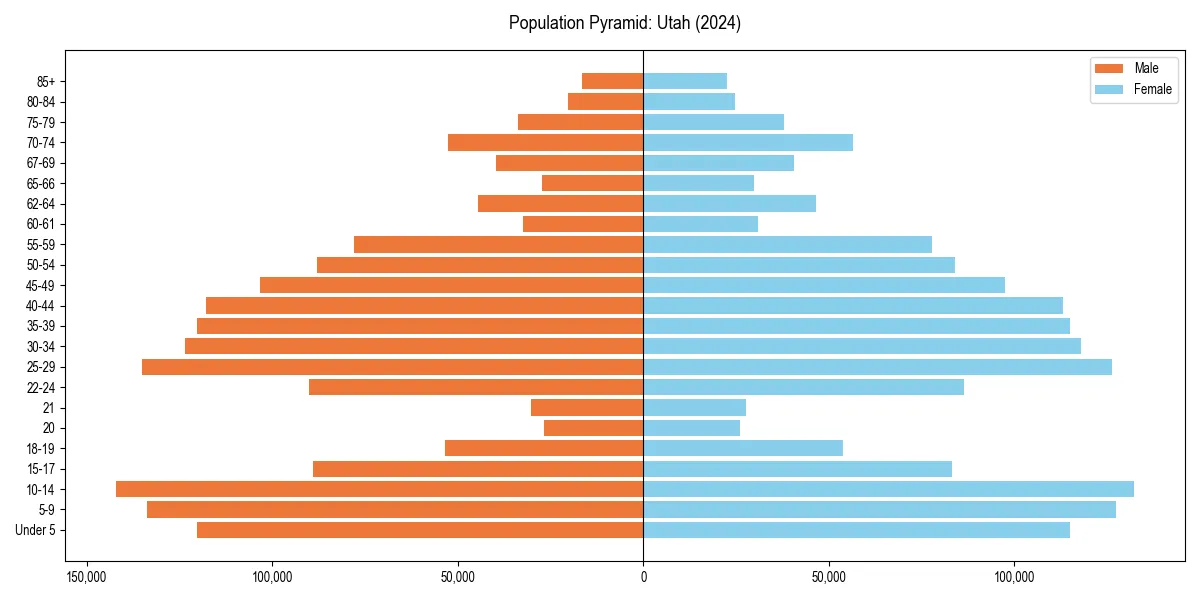
Figure 2: Population distribution by age and gender for 2024.
Utah Historical Population Data
| Year | Median Age | Population |
|---|---|---|
| 2024 | 32.0 | 3,392,331 |
| 2023 | 31.7 | 3,331,187 |
| 2022 | 31.4 | 3,283,809 |
| 2021 | 31.3 | 3,231,370 |
| 2020 | 31.1 | 3,151,239 |
| 2019 | 30.8 | 3,096,848 |
| 2018 | 30.7 | 3,045,350 |
| 2017 | 30.5 | 2,993,941 |
| 2016 | 30.3 | 2,948,427 |
| 2015 | 30.1 | 2,903,379 |
| 2014 | 29.9 | 2,858,111 |
| 2013 | 29.6 | 2,813,673 |
| 2012 | 29.3 | 2,766,233 |
| 2011 | 29.1 | 2,715,379 |
| 2010 | 28.8 | 2,657,236 |
Utah Age Group Breakdown (2024)
| Age Cohort | Percentage |
|---|---|
| Under 5 | 6.9% |
| 5–17 | 20.9% |
| 18–24 | 11.6% |
| 25–34 | 14.8% |
| 35–54 | 24.7% |
| 55–64 | 9.1% |
| 65+ | 11.9% |
Dependency Ratios for Utah
- Total Dependency Ratio:
- 65.7
- Youth Dependency:
- 46.1
- Old-Age Dependency:
- 19.7
The dependency ratio measures dependents (ages 0-17 and 65+) per 100 working-age individuals (ages 18-64).
Age & Gender FAQs for Utah
The median age in Utah is 32.0 years.
According to latest Census data, the total population of Utah is 3,392,331.
In Utah, seniors (ages 65+) make up 11.9% of the population, while children under 18 represent 20.9%.
Based on historical data since 2010, the population in Utah is aging.