Cache County, Utah Nativity & Citizenship Status (2024)
Place of birth and citizenship status analysis for Cache County, Utah
Cache County, Utah Nativity & Citizenship Indicators (2024)
Native Born
93.7%
Foreign Born
6.3%
Naturalized
2.6%
US Citizens
96.2%
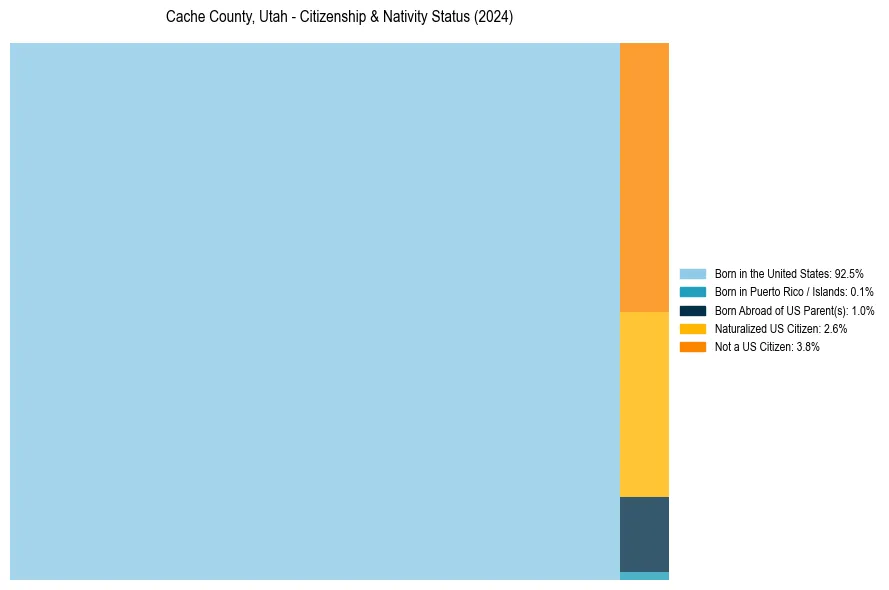
Cache County, Utah Nativity & Citizenship Distribution
Cache County, Utah Historical Nativity Trends (2010–2024)
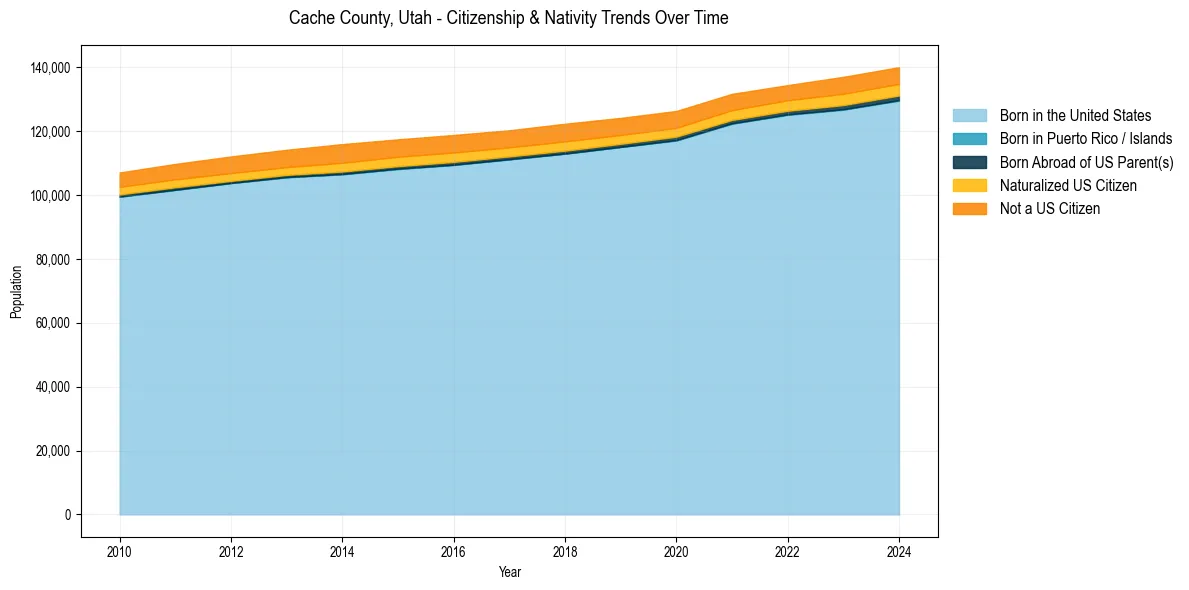
Cache County, Utah Population & Nativity History
| Year | Total Pop | Foreign Born | Native Born |
|---|---|---|---|
| 2024 | 140,046 | 6.3% | 93.7% |
| 2023 | 137,031 | 6.5% | 93.5% |
| 2022 | 134,428 | 6.0% | 94.0% |
| 2021 | 131,703 | 6.2% | 93.8% |
| 2020 | 126,336 | 6.4% | 93.6% |
| 2019 | 124,165 | 6.5% | 93.5% |
| 2018 | 122,336 | 6.9% | 93.1% |
| 2017 | 120,288 | 6.8% | 93.2% |
| 2016 | 118,824 | 7.1% | 92.9% |
| 2015 | 117,449 | 7.2% | 92.8% |
| 2014 | 115,954 | 7.4% | 92.6% |
| 2013 | 114,181 | 6.9% | 93.1% |
| 2012 | 112,095 | 6.8% | 93.2% |
| 2011 | 109,752 | 6.7% | 93.3% |
| 2010 | 107,078 | 6.4% | 93.6% |
Nativity & Citizenship FAQs for Cache County, Utah
Approximately 6.3% of residents in Cache County, Utah were born outside the United States.
The vast majority of residents, roughly 96.2%, are U.S. citizens (including both native-born and naturalized citizens).