Vermont Age & Gender Distribution (2024)
Population distribution by age and gender for Vermont
Vermont Age & Gender Statistics (2024)
Total Population
647,106
Median Age
43.1
Male Median
42.0
Female Median
44.2
Vermont Population Growth
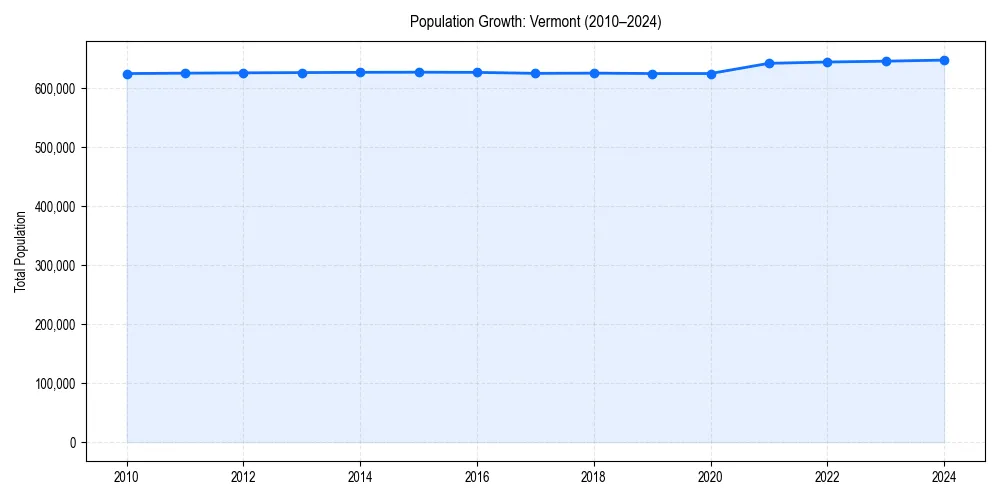
Vermont Demographic Trend
Since 2010, the population of has changed by +3.7%%.
+3.7%% Growth
Vermont Age & Gender Pyramid
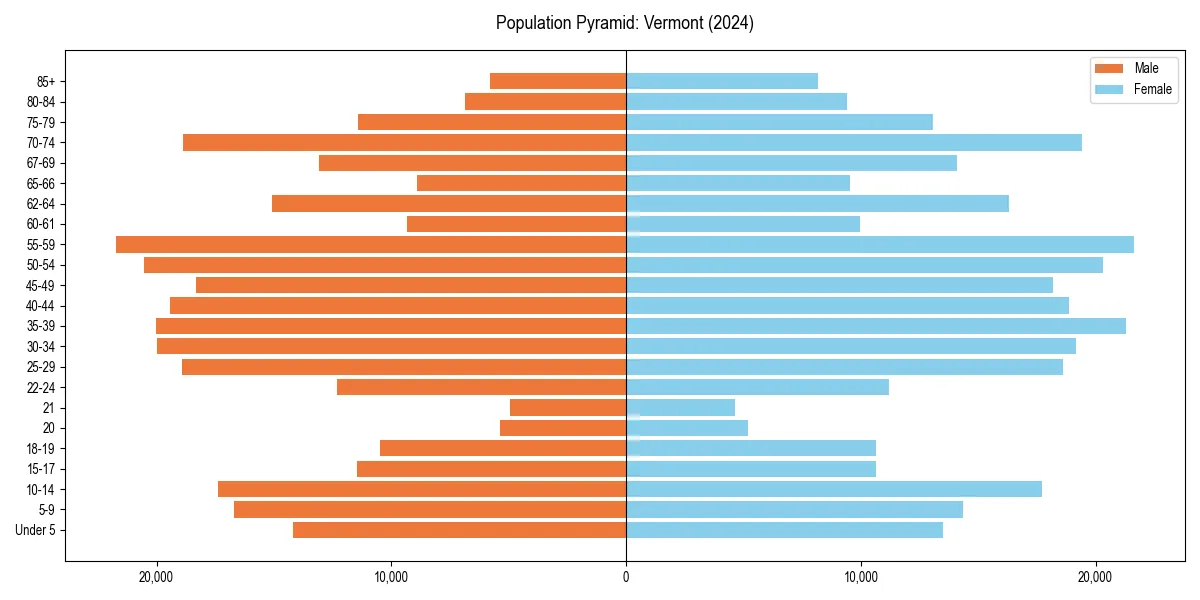
Figure 2: Population distribution by age and gender for 2024.
Vermont Historical Population Data
| Year | Median Age | Population |
|---|---|---|
| 2024 | 43.1 | 647,106 |
| 2023 | 43.0 | 645,254 |
| 2022 | 42.9 | 643,816 |
| 2021 | 42.7 | 641,637 |
| 2020 | 42.8 | 624,340 |
| 2019 | 42.9 | 624,313 |
| 2018 | 42.9 | 624,977 |
| 2017 | 42.8 | 624,636 |
| 2016 | 42.6 | 626,249 |
| 2015 | 42.4 | 626,604 |
| 2014 | 42.2 | 626,358 |
| 2013 | 42.0 | 625,904 |
| 2012 | 41.7 | 625,498 |
| 2011 | 41.4 | 624,958 |
| 2010 | 41.0 | 624,258 |
Vermont Age Group Breakdown (2024)
| Age Cohort | Percentage |
|---|---|
| Under 5 | 4.3% |
| 5–17 | 13.6% |
| 18–24 | 10.0% |
| 25–34 | 11.9% |
| 35–54 | 24.3% |
| 55–64 | 14.5% |
| 65+ | 21.4% |
Dependency Ratios for Vermont
- Total Dependency Ratio:
- 64.9
- Youth Dependency:
- 29.6
- Old-Age Dependency:
- 35.3
The dependency ratio measures dependents (ages 0-17 and 65+) per 100 working-age individuals (ages 18-64).
Age & Gender FAQs for Vermont
The median age in Vermont is 43.1 years.
According to latest Census data, the total population of Vermont is 647,106.
In Vermont, seniors (ages 65+) make up 21.4% of the population, while children under 18 represent 13.6%.
Based on historical data since 2010, the population in Vermont is aging.