Accomack County, Virginia Nativity & Citizenship Status (2024)
Place of birth and citizenship status analysis for Accomack County, Virginia
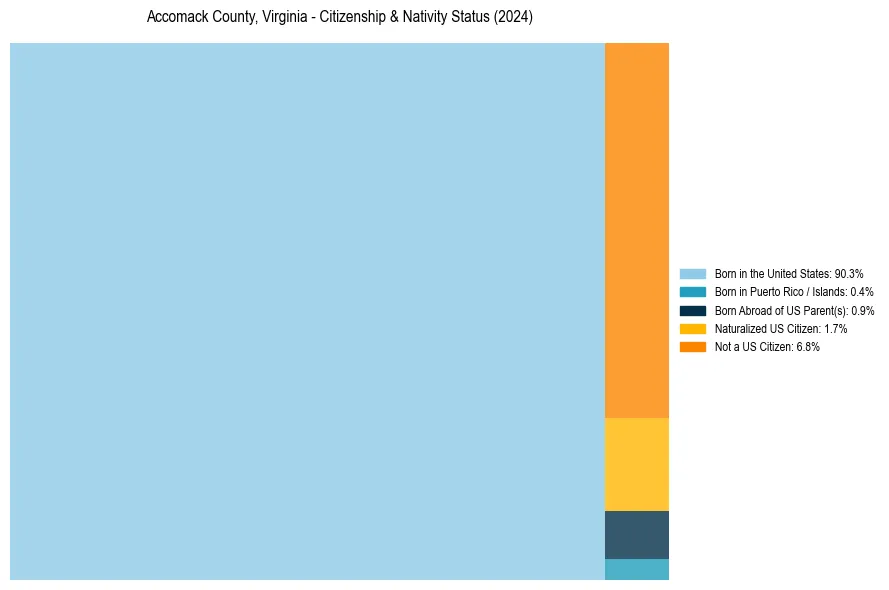
Accomack County, Virginia Nativity & Citizenship Indicators (2024)
Native Born
91.5%
Foreign Born
8.5%
Naturalized
1.7%
US Citizens
93.2%
Accomack County, Virginia Nativity & Citizenship Distribution
Accomack County, Virginia Historical Nativity Trends (2010–2024)
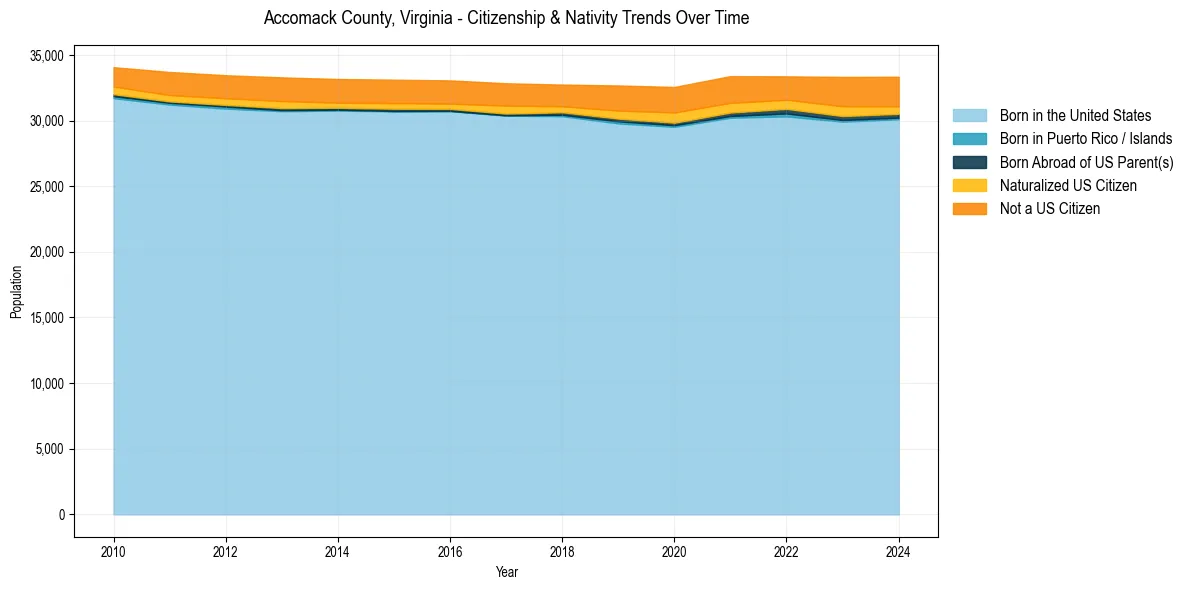
Accomack County, Virginia Population & Nativity History
| Year | Total Pop | Foreign Born | Native Born |
|---|---|---|---|
| 2024 | 33,335 | 8.5% | 91.5% |
| 2023 | 33,326 | 9.0% | 91.0% |
| 2022 | 33,367 | 7.4% | 92.6% |
| 2021 | 33,388 | 8.3% | 91.7% |
| 2020 | 32,560 | 8.4% | 91.6% |
| 2019 | 32,673 | 7.7% | 92.3% |
| 2018 | 32,742 | 6.4% | 93.6% |
| 2017 | 32,840 | 7.0% | 93.0% |
| 2016 | 33,060 | 6.6% | 93.4% |
| 2015 | 33,115 | 6.7% | 93.3% |
| 2014 | 33,165 | 6.6% | 93.4% |
| 2013 | 33,289 | 7.0% | 93.0% |
| 2012 | 33,454 | 6.8% | 93.2% |
| 2011 | 33,701 | 6.7% | 93.3% |
| 2010 | 34,066 | 6.0% | 94.0% |
Nativity & Citizenship FAQs for Accomack County, Virginia
Approximately 8.5% of residents in Accomack County, Virginia were born outside the United States.
The vast majority of residents, roughly 93.2%, are U.S. citizens (including both native-born and naturalized citizens).